

Weekly Crypto Market Update: Bitcoin Breaks Its Range on a Soft CPI, but Oil and Iran Keep It a Possible Bull Trap - July 17, 2026
Analyst Summary
Bitcoin has broken out of the neutral-scenario range on the back of a very positive June inflation report and is now trading near $64,689, with a weekly high of $65,277. Nonetheless, we still believe it is the neutral scenario that is playing out: this breakout could turn out to be a trap for longs, given the escalation of the conflict with Iran and the renewed rise in oil prices. Sentiment has improved to 34, but it remains in the fear zone. Buyers continue to buy the dips actively, but the advance is being held back by outflows from spot BTC ETFs and selling by short-term holders locking in losses. The inflation data came in positive - annual inflation slowed and the monthly reading fell - but it is too early to celebrate: oil has spiked back above $85, and the July data could turn out negative. A separate theme is Solana, where on-chain metrics look steadily strong against the broad risk-off backdrop.
Key Market Snapshot
Asset |
7D Change |
Trend |
Analyst Bias |
|---|---|---|---|
BTC |
+3.9% |
Ascending |
Cautiously-Bullish |
ETH |
+10.2% |
Ascending |
Cautiously-Bullish |
Altcoins (TOTAL3ES on Tradingview) |
+1.6% |
Range |
Neutral |
Last Week's Watchlist: What Happened?
- Bitcoin broke out of the neutral-scenario range, but it is too early to call this a growth scenario - it could be a trap for longs.
- The conflict around the Strait of Hormuz continues to worsen - the sides are exchanging strikes, and disruptions to oil supply persist.
- Bitcoin ETF outflows continue, but they are no longer as steady: daily outflows alternate with inflows. The outflow over the past 7 days amounted to $333.3 million.
- Order book: dip-buying continues, and selling is not yet very active.
- Liquidations on July 13: during the decline, long liquidations amounted to $342 million, but most positions had been closed in advance, so there was no price collapse from liquidations.
- U.S. inflation slowed sharply in June: CPI -0.4% m/m versus -0.1% expected; CPI +3.5% y/y versus +3.8%; Core CPI +2.6% y/y versus +2.8%.
What Moved the Market This Week?
Bitcoin broke out of its trading range thanks to a very positive June inflation report. This triggered short liquidations of more than $300 million - a small amount, but enough to support the advance.
The contrast is worth noting: on July 13, long liquidations amounted to $342 million, and yet the rally on the inflation release proved stronger. The reason is that the July 13 decline was actively bought, while on the subsequent rise there were not many large sellers. This is confirmed by order-book depth data: whenever market depth dropped as buy orders were filled, it almost immediately recovered on the buy side, which indicates that new bids were being placed.
The continuation of the rally was held back by the escalation of the Iran conflict, rising oil prices and, consequently, outflows from spot BTC ETFs, as well as by selling by short-term holders locking in losses during the rally. According to CryptoQuant, on July 14-15 short-term holders sent to exchanges and sold more than 32,000 Bitcoin, realizing losses. This is classic weak-hand behavior on a bounce, and it is precisely this - alongside the ETF outflows - that is capping the upward momentum.
U.S. Inflation: A Slowdown in June
Chart: Heatmap of U.S. CPI
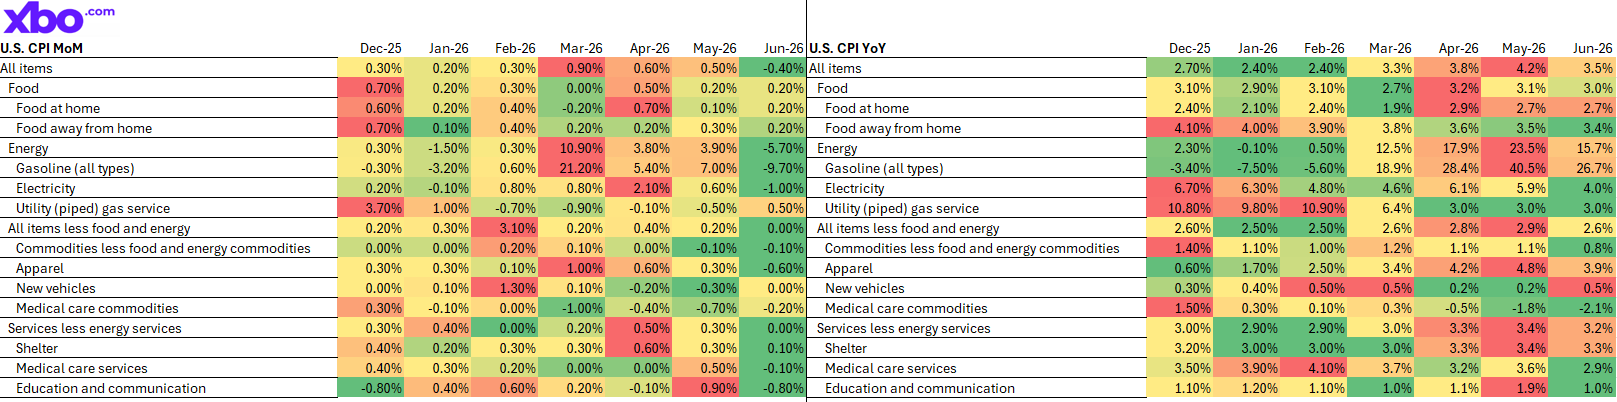
Chart source: U.S. Bureau of Labor Statistics
Asset/market: U.S. CPI by component
Timeframe: Monthly, Yearly
Metric: CPI heatmap
Data checked: July 16, 2026, 08:00 UTC
In one of our previous reviews, we already noted that the rise in oil prices was short-lived and may not have fully filtered through to the economy. The June inflation data so far confirms this assumption. Consumer inflation slowed on an annual basis and turned negative month-over-month.
On top of that, services prices did not increase during the month - and the services sector has the highest weight in the index, at around 60%. Gasoline prices also fell significantly, by 9.7% over the month.
The producer-inflation data also came in positive. The annual Producer Price Index (PPI) came in at 5.5%, against a forecast of 6.2% and a previous reading of 6.0%. On a monthly basis, the PPI fell 0.3%, against a forecast of 0.0% and a previous +0.6%. Core PPI rose 0.2% month-over-month, against a forecast of 0.3%, and came in at 4.7% year-over-year, against a forecast of 5.2%.
But it is not that simple. First, from its March peak, oil prices fell 18% in April, then rose again to a peak in May, after which it dropped below $75 per barrel - and the current slowdown in inflation may have been caused precisely by that April decline. Second, because of the current escalation of the conflict, prices have again spiked above $85. All of this suggests that the July inflation data could once again come in stronger than expected, and in that case the continuation of the rally will depend on the market's expectations of when a de-escalation between Iran and the United States will occur.
What Else Could Push Oil Higher Besides the Iran Conflict?
The risk of rising oil prices is also driven by the government's oil reserves. The U.S. government's reserve data is available: over the week, the U.S. Strategic Petroleum Reserve shrank by 3 million barrels and now stands at 316.5 million barrels. Combined with commercial inventories, total stocks amount to 730 million barrels - the lowest level since 1984.
For this reason, time is not on the United States' side in the conflict with Iran. If Iran manages to drag out the standoff, the U.S. will have to buy oil at already-high prices to rebuild its reserves - and that will stimulate an even stronger rise in oil prices and, consequently, in all petroleum products and transportation services. It is still hard to say how long these reserves will last and at what pace the U.S. government will replenish them, but the low-reserve factor itself remains a long-term inflationary risk.
What to Watch Next
The key is to watch price action and the order book on declines: if every dip continues to be actively bought, it means demand is becoming ever more resilient. The same logic should be applied to price rises - to gauge whether seller pressure is easing.
It is also important to keep tracking fund flows in ETFs: a good signal would be a significant slowdown in selling by the funds and a return to sustained inflows. Separately, it is necessary to watch oil prices and changes in U.S. crude reserves - in particular, the moment when the government begins to replenish them. In addition, it is worth keeping in focus the behavior of short-term holders - whether they continue to lock in losses during the rally - as well as the upcoming July inflation releases, which, because of the renewed oil spike, could come in worse than June's. And, as always, the news flow around Iran and the Strait of Hormuz remains key.
Analyst Opinion
Current view: what matters now is for Bitcoin to hold at current levels or rise above $68,000 and consolidate there - only then will it be possible to speak of a resumption of the global uptrend. For now, the positive signals are there, buyers remain active, and the inflation data looks very good. But we interpret the breakout cautiously: it could be a trap for longs, given rising oil prices and the conflict with Iran.
Rationale: the rally is supported by a good CPI print and short liquidations, and order-book depth quickly recovers on the buy side after bids are filled. In parallel, however, there are ETF outflows and selling by short-term holders - more than 32,000 BTC on July 14-15 - which points to the fragility of the momentum. Demand is outweighing supply for now, but the advantage is not locked in.
Confirmation level: the conditions for a reversal into a sustained uptrend remain the same - ETF inflows need to resume and positive news on Iran needs to appear. A hold above $68,000 would be the confirmation.
Invalidation: the main threat right now is rising oil prices as a result of the escalating conflict with Iran. Sustained oil above $85 could bring back the inflation narrative as early as the July data, intensify ETF outflows and short-term-holder selling, and drag the price back below $60,000. Triggers could also include sharply negative news on the Strait of Hormuz and a return to steady fund outflows.
Scenarios for the Week Ahead
Neutral scenario. The breakout turns out to be a trap for longs: Bitcoin fails to hold the levels it gained and returns to the broad trading zone of $61,000-$65,000. Oil and Iran cap the momentum, ETF outflows alternate with inflows, and short-term holders continue to lock in losses on bounces.
Growth scenario. The Iran conflict de-escalates, oil declines, ETF inflows resume, and the July inflation data confirms disinflation. Renewed demand keeps the price above $68,000, and the global uptrend can be considered to have resumed.
Decline scenario. The conflict escalates, oil remains above $85, July inflation comes in "hot," and ETF outflows become steady again. Short-term-holder selling intensifies, and Bitcoin returns below $60,000, toward the demand zones around $58,000.
In Focus: Solana - Quietly Strong On-Chain Amid the Risk-Off
Chart: On-Chain of Solana
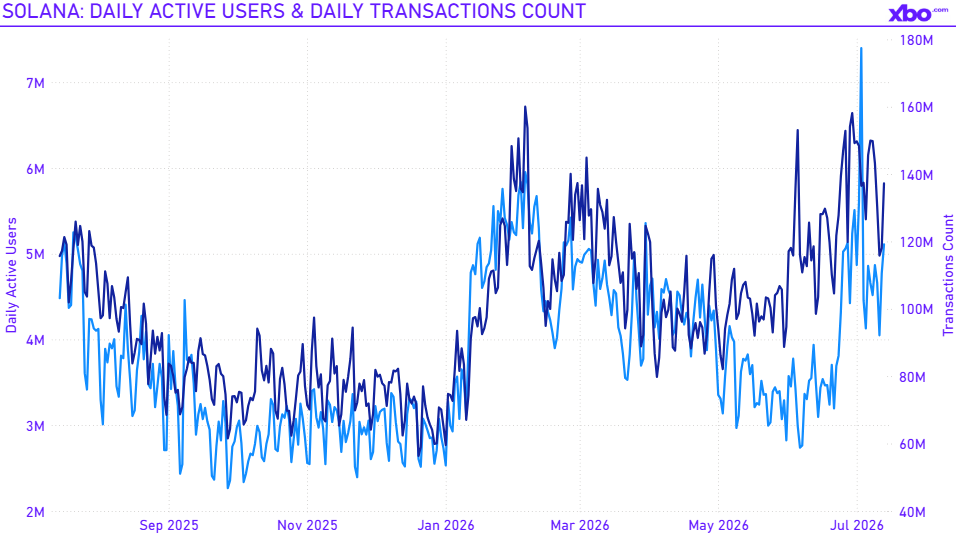
Chart source: Artemis.ai
Asset/market: Solana
Timeframe: Daily
Metric: Daily active addresses, daily transactions
Data checked: July 16, 2026, 08:00 UTC
Against the broader risk-off backdrop, Solana looks stable. The token is trading around $78 and has gained 24% since the 6th of June - noticeably outperforming the broad market. But the key point is that Solana's strength is underpinned by on-chain metrics, not just by price.
The main focus is on network activity. The daily number of transactions has recovered to around 130-150 million in early to mid-July, rebounding from the slump in the second half of 2025, when it fell toward 60-90 million. The daily number of active users is holding near the top of its range, at around 5 million. In other words, both transactions and the user base are growing steadily rather than stagnating - which is the main sign of the ecosystem's health.
TVL is no less important. According to DefiLlama, in dollar terms it stands at $4.8 billion, but this reflects price dynamics more than capital flows. Measured in SOL, the locked amount is not declining but continues to trend higher overall and sits near cyclical highs. This is a key structural signal: despite the weak external backdrop, participants are not withdrawing capital from the ecosystem but increasing the amount of SOL locked, which points to durable confidence in the network.
There is also a more restrained side of the picture that is worth noting. Real Economic Value and Chain Fees have declined markedly over the past year: they now stand at roughly $0.5 million and $0.42 million per day, respectively, versus substantially higher levels a year ago. In other words, activity and user numbers are growing, but the monetization of that activity at the network level is falling - transactions are becoming cheaper and generating fewer fees. For users this is a plus, but as an indicator of network profitability it is a signal worth watching.
The structure is rounded out by a large stablecoin segment on the network - around $15.6 billion - and a real-world-asset market of about $3.3 billion, according to RWA.xyz, which confirms Solana's role as one of the main venues for settlement and tokenization.
Institutional interest also remains steady. The lineup of spot Solana ETFs from Bitwise, VanEck, Fidelity, 21Shares, Franklin Templeton, and Grayscale has collectively attracted around $1.13 billion in net inflows since launch, with virtually no significant outflows - daily flows remain small and predominantly positive. A new spot ETF from Morgan Stanley is on the way, which will broaden institutional access to the asset.
All in all, Solana is currently one of the few segments of the market where the on-chain fundamentals, the price action, and institutional flows are all moving in the same direction: growing transactions and users, rising TVL in token terms, and steady ETF inflows. The decline in fees and network economic value remains a nuance to watch, but it does not change the fact that, in the current phase, Solana stands out as a relative market leader.
Risks for the Week Ahead
- A sustained rise in oil prices above $85 due to the escalating conflict with Iran - the main threat, capable of bringing back the inflation narrative as early as the July data.
- A further escalation around the Strait of Hormuz.
- A continuation of outflows from spot BTC and ETH ETFs and their return to a steady outflow pattern.
- Intensified selling by large holders locking in losses on the rise.
- Low U.S. strategic and commercial oil reserves - a long-term inflationary factor.
The main short-term risk is a combination of a fresh oil spike and a "hot" July inflation print.
Watchlist for the Week
- Price and order book: the resilience of dip-buying and the density of buy orders.
- Spot BTC and ETH ETF flows: a return to sustained inflows as confirmation of a reversal.
- Oil price and the U.S. Strategic Petroleum Reserve: Brent's movement above or below $85, and the moment when the U.S. begins to replenish its reserve.
- Short-term and large holders: whether loss-taking during the rally continues.
- July inflation (next month): CPI and Core CPI on a monthly basis, against the renewed oil spike.
- Iran and the Strait of Hormuz: signs of escalation or de-escalation.
- BTC levels: confirmation of a reversal - a hold above $68,000; demand zones at $61,000, $60,000, and $58,000.
Final Takeaway
Bitcoin has broken out of the neutral-scenario range on a strong inflation report and is trading near $64,689, but we interpret this breakout cautiously - as a possible trap for longs. Demand is holding up: dips are being bought and order-book depth quickly recovers on the buy side; however, the momentum is being held back by ETF outflows and by selling by short-term holders, who sent more than 32,000 BTC to exchanges over two days. The June inflation data came in firmly disinflationary, but the renewed oil spike above $85 amid the Iran conflict and record-low U.S. reserves mean that July inflation data could come in hotter than expected - so the only durable confirmation of a resumed uptrend remains a hold above $68,000. Against this backdrop, Solana stands out as a relative leader: growing transactions and active addresses, resilient TVL in SOL terms, and steady ETF inflows with virtually no outflows. Until sustained ETF inflows return and the conflict with Iran de-escalates, the priority remains confirmation signals and risk management.
Methodology
This weekly update analyzes crypto market structure, technical indicators, liquidity and market-depth conditions, derivatives and liquidation data, on-chain activity, and sentiment data through the lens of asset price changes, along with relevant macroeconomic, corporate, and regulatory developments. The analysis is based on data available at the time of publication and may change as new market information becomes available.
Disclaimer
This article is for educational and informational purposes only and does not constitute financial, investment, or trading advice. Crypto assets are volatile, and past performance is not a reliable indicator of future results. Always conduct your own research and consider your risk tolerance before making trading decisions.



.png)