


Weekly Crypto Market Update: Bitcoin Rebounds as Buyers Return, but Iran and Shrinking Stablecoin Liquidity Cap the Upside - July 9, 2026

Analyst Summary
The growth scenario we flagged as less likely in the previous issue has begun to play out - but so far without confirmation. Whale bids held the $58,200 level, after which Bitcoin rebounded and is now trading near $62,800, with a weekly peak of $64,042. The driver of the recovery was a reversal of flows in spot ETFs: over the week, $423 million came into Bitcoin funds, against outflows in prior periods. The demand structure continues to strengthen - dips below $59,000 were bought up, and market depth is once again filling up mainly with buy orders; sentiment improved to 28, though it remains in the fear zone. The positivity, however, is not durable: the Iran conflict has escalated again, disruptions in the Strait of Hormuz have resumed, and oil has risen by $7 to $78. A separate theme of the week is stablecoins: in the second quarter of 2026, net issuance turned negative by $6.0 billion, and this weakens the fuel for growth not just for Bitcoin, but for the entire broad crypto market.
Key Market Snapshot
|
Asset |
7D Change |
Trend |
Analyst Bias |
|---|---|---|---|
|
BTC |
+4.9% |
Ascending |
Cautiously-Bullish |
|
ETH |
+9% |
Ascending |
Cautiously-Bullish |
|
Altcoins (TOTAL3ES on Tradingview) |
+3.4% |
Ascending |
Cautiously-Bullish |
Last Week's Watchlist: What Happened?
- The growth scenario began to play out, but so far without confirmation - Bitcoin recovered, but did not hold above $68,000; the weekly peak was $64,042.
- Inflows into Bitcoin ETFs appeared: the inflow over 7 days amounted to $423 million - the first meaningful inflows since May.
- Market depth and whale bids: dip-buying persisted, and buy orders are once again dominant - demand is becoming more resilient.
- The $55,000 level (the risk zone for treasuries): untouched - whales held $58,200.
- U.S. inflation-related economic releases: none have come out yet; they are due next week.
- The situation in Iran: instead of de-escalation, a fresh flare-up and disruptions in the Strait of Hormuz.
What Moved the Market This Week?
The market rose on the positivity from ETF inflows. Whale bids held the $58,200 level, after which the rebound began. The market-depth charts clearly show how, on July 2, market depth collapsed sharply at the very start of the move higher - but it is now recovering again, and buy orders once more dominate within it, even though price has already bounced. Additional support came from the dollar index, which fell by less than one point over the week.
The positive picture is spoiled by the escalation of the Iran conflict. The sides have again accused each other of attacks, and disruptions to ship passage have resumed in the Strait of Hormuz. How long this will last cannot yet be said with certainty.
Liquidation Map: A Tactical Risk Around $61,500
Chart: BTC Liquidation Map
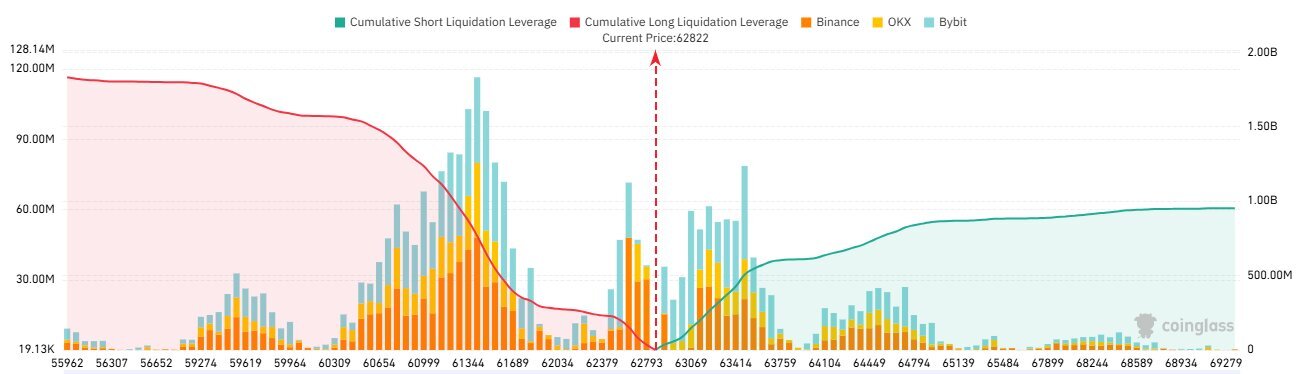
Chart source: CoinGlass
Asset: BTC
Timeframe: Current snapshot
Metric: Cumulative long/short liquidation leverage (liquidation map)
Data checked: July 9, 2026, 09:00 UTC
Open interest in futures on centralized exchanges is currently barely changing, and there were no significant liquidations during the price rebound. Nonetheless, the liquidation map paints a picture that is risky for the upside - in the event of sudden, sharply negative news on the Strait of Hormuz or unexpectedly weak inflation data.
Looking at the map, it is clear that a sharp decline in price toward the $61,500 mark could trigger a wave of long-position liquidations that would correct the price back below $60,000. Globally this is not critical, but tactically it could delay the recovery.
On the other hand, short-position liquidations, while not as densely clustered as the longs, are stretched across a wide price range. In theory, given strong positive news, this could push the price above $68,000 on liquidations alone.
Orders Decomposition, Once Again
Right now it is crucial to watch the behavior of market participants through their orders. This week, when Bitcoin dropped below $59,000, market-depth data showed that almost all of the spot buy-order advantage had been exhausted - but that volume very quickly began to recover alongside the rebound.
This is a very good signal. Buyers, fearing that the bottom has already passed, began actively placing new orders once the old ones had been filled. This is also confirmed by the whale-bid metric: whales are actively placing orders in the $58,000 to $62,500 range, inclusive.
For now, all of this confirms the market's general assumption that we discussed in previous reviews: buying interest is gradually returning.
What to Watch Next
The main thing is to watch price behavior and the order book on declines: if every dip continues to be actively bought, it means demand is becoming ever more resilient. The same logic should be applied to price rises - to gauge whether seller pressure is easing.
It is also important to keep tracking fund flows in ETFs: a good signal would be the persistence of inflows - especially if they hold up until the end of the Iran conflict - and a significant slowdown in selling by the funds. As we said last week, it is also necessary to watch all available U.S. economic releases related to inflation, in order to assess how deeply it has seeped into the economy - and, as before, these releases are due next week, the most important being CPI and Core CPI on a month-over-month basis. And, finally, it is separately important to monitor the situation in Iran for any further escalation.
Analyst Opinion: Positivity Returning, but Not Yet Durable
Current view: positivity has begun to return, but it is not yet durable - especially given the escalation in Iran and the renewed rise in oil, which added $7 to reach $78. That said, no panic was visible in the market, so it is reasonable to assume that participants are counting on a short-lived escalation. In that case, the base case is that Bitcoin holds steadily within the $61,000-$64,000 range.
Rationale: for the first time in several weeks, the active flows have turned in favor of buyers - ETF inflows, the defense of $58,200 by whale bids, and the rapid recovery of market depth after dips below $59,000 were bought up. Whales have again placed bids in the $58,000-$62,500 range. But the advantage is not yet locked in: the escalation in Iran, rising oil, and the upcoming inflation releases could quickly bring back selling pressure from ETFs.
Confirmation level: the conditions for a reversal remain the same - ETF inflows need to continue, there should be no surprises on Iran or inflation, and Bitcoin ultimately needs to hold above $68,000. Given strong positive news, the short liquidations stretched across the range could, in theory, accelerate that move.
Invalidation: a sharp decline toward $61,500 could trigger a cascade of long liquidations and push the price back below $60,000. The triggers for this could be sudden, sharply negative news on the Strait of Hormuz, unexpectedly "hot" inflation data next week, a further escalation in Iran with a renewed oil spike, or a return of ETF outflows. Or large market sell orders, as we already saw in one of our previous reviews.
Trading takeaway: in the current conditions, the priority is to confirm the return of demand with facts rather than expectations: the durability of ETF inflows, the speed at which buy orders recover in the order book, and the absence of negative surprises on Iran and inflation. Until these confirmations appear, the rebound remains tactical rather than a reversal, and it calls for risk management near the liquidation cluster at $61,500.
Scenarios for the Week Ahead
Neutral scenario. Bitcoin holds within the $61,000-$64,000 range. The market assumes the escalation in Iran will be short-lived; ETF inflows remain moderate, market depth continues to recover, and dips are bought up. Price consolidates while awaiting the inflation releases and a resolution on the Strait of Hormuz.
Growth scenario. ETF inflows continue, the Iran conflict de-escalates, and inflation data comes in favorable. Returning demand breaks through the weekly peak of $64,042, and given the short liquidations stretched across the range, a squeeze could accelerate the move toward the confirmation zone above $68,000.
Decline scenario. Sudden, sharply negative news on the Strait of Hormuz or a "hot" inflation print pushes price toward $61,500 and triggers a cascade of long liquidations, sending Bitcoin back below $60,000. Globally this does not break the structure, but tactically it delays the recovery and brings attention back to the demand zone around $58,000.
In Focus: Stablecoin Liquidity - The Market's Dry Powder Is Shrinking
Chart: Quarterly Stablecoins Emission
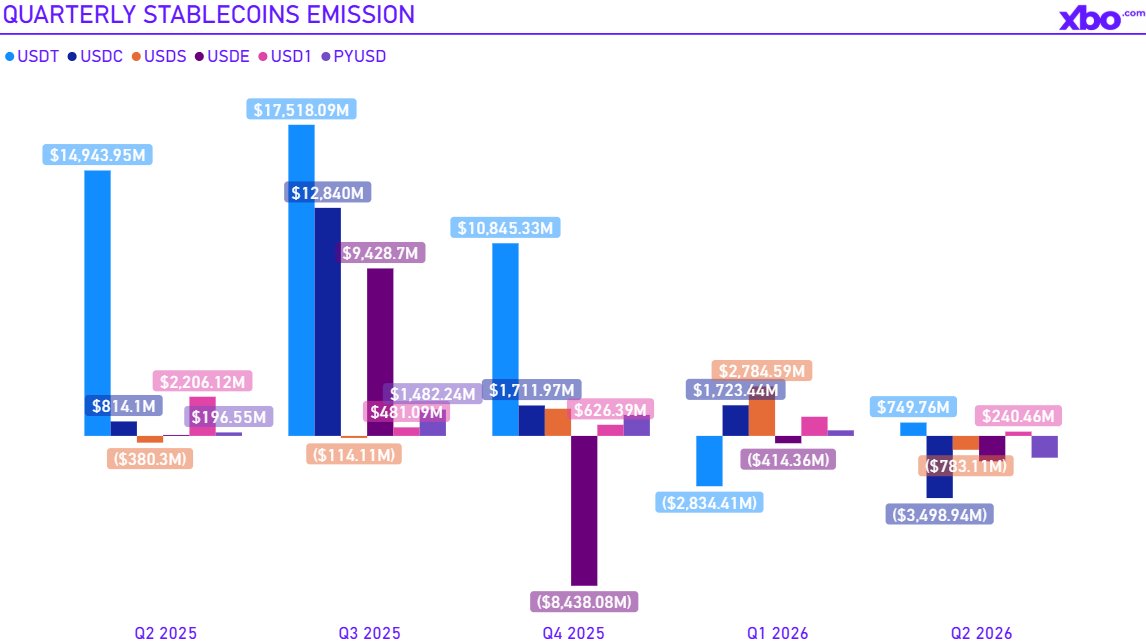
Chart source: XBO.com, RWA.xyz
Asset/market: Top-6 stablecoins by market cap
Timeframe: Quarterly
Metric: Net stablecoin issuance
Data checked: July 9, 2026, 09:00 UTC
Stablecoin issuance is the most direct indicator of fresh fiat capital flowing into the crypto ecosystem. When a new stablecoin is minted, a dollar ready to buy a crypto asset enters the system; when a stablecoin is redeemed, a dollar leaves it. Net issuance is, in effect, the market's "dry powder": a pool of capital capable of converting into demand for Bitcoin and altcoins.
In the second quarter of 2026, this indicator flashed a warning. After a peak inflow of +$41.6 billion in the third quarter of 2025, net issuance slowed for two consecutive quarters and, in the second quarter of 2026, turned negative for the first time, at -$6.0 billion. In other words, stablecoins were not merely being minted less actively - they were being net-redeemed, and the aggregate pool of on-chain dollars shrank.
The contraction was broad-based. Of the six largest stablecoins, only two posted net growth: USDT and USD1. The rest contracted, with redemptions led precisely by the "institutional" USDC - down $3.5 billion for the quarter; PYUSD (-$1.2 billion), USDE (-$1.4 billion), and USDS (-$0.8 billion) also shrank noticeably. The sector's total market capitalization remains high - around $277 billion across the six largest issuers - but its trajectory over the quarter turned from growth to decline.
Stablecoin dynamics serve as a crypto-native reflection of what the macro data show. Fed liquidity is not growing; here, on-chain liquidity has not only stopped growing but has begun to contract. Both indicators point to the same thing: no additional fuel for growth is being added to the system.
From this follow data-based expectations for the market in the second half of the year. Even if the external backdrop turns in favor of risk - de-escalation of the conflict in Iran, cheaper oil, slowing inflation, and a softening of the Fed's rhetoric - sustained market growth will require an inflow of new capital. And the stablecoin pool from which that capital comes is currently shrinking. On that basis, experts expect that, in the event of a reversal, the broad crypto market will find it harder to rise: a sentiment-driven bounce is possible, but a full and durable uptrend requires the stablecoin base to begin expanding again. Net stablecoin issuance is therefore worth tracking as a leading indicator of any recovery: as long as it remains negative, growth across the whole market will stay fragile and thinly backed by liquidity.
Risks for the Week Ahead
- A further escalation of the Iran conflict and disruptions in the Strait of Hormuz, along with a renewed rise in oil and the dollar index, which could re-ignite inflation.
- A cascade of long liquidations on a sharp decline toward $61,500, which could send price back below $60,000.
- "Hot" U.S. inflation data next week, undermining the disinflation thesis.
- A contraction in stablecoin liquidity, limiting growth across the entire broad crypto market.
- A return of outflows from spot BTC and ETH ETFs after the inflows.
- A pickup in selling from corporate treasuries or miners, which remains a latent risk for now.
- Fragile sentiment: at 28, the index remains in the fear zone and is vulnerable to negative surprises.
The main short-term risk is a coincidence of a negative geopolitical or inflation surprise with the liquidation cluster at $61,500, precisely at a moment when demand has not yet locked in.
Watchlist for the Week
- Order book and market depth: the resilience of dip-buying and the density of whale bids in the $58,000-$62,500 zone.
- Spot BTC and ETH ETF flows: the persistence of inflows as confirmation of a reversal.
- Liquidation map: the long cluster at $61,500 and the shorts stretched all the way to $68,000.
- U.S. inflation-related economic releases: due next week.
- Iran and the Strait of Hormuz, and the oil price: signs of escalation or de-escalation.
- Net stablecoin issuance: a return to positive readings as a condition for sustained market-wide growth.
- BTC levels: the weekly peak of $64,042, confirmation of a reversal above $68,000; demand zones at $60,000 and $58,000.
Final Takeaway
The growth scenario has begun to play out: whale bids held $58,200, ETF inflows turned flows in favor of buyers, and Bitcoin recovered to $62,800; market depth is once again filling up with buy orders, and whales have placed bids in the $58,000-$62,500 range - buying interest is returning. But the positivity is not yet durable: the Iran conflict has escalated, oil has risen by $7 to $78, and there was no panic in the market, so the base case is consolidation within the $61,000-$64,000 range, where the tactical risk is the liquidation cluster at $61,500 that could send price back below $60,000, while confirmation of a reversal remains a hold above $68,000. The key structural constraint lies beyond Bitcoin: in the second quarter, net stablecoin issuance turned negative, which means that even with a favorable turn in the macro backdrop, the broad crypto market will find it harder to sustain growth without an inflow of new capital. Until ETF inflows are confirmed, tensions on Iran ease, and the stablecoin base expands, the priority remains confirmation signals and risk management.
Methodology
This weekly update analyzes crypto market structure, technical indicators, liquidity and market-depth conditions, derivatives and liquidation data, on-chain activity, and sentiment data through the lens of asset price changes, along with relevant macroeconomic, corporate, and regulatory developments. The analysis is based on data available at the time of publication and may change as new market information becomes available.
Disclaimer
This article is for educational and informational purposes only and does not constitute financial, investment, or trading advice. Crypto assets are volatile, and past performance is not a reliable indicator of future results. Always conduct your own research and consider your risk tolerance before making trading decisions.



.png)