Weekly Crypto Market Update: Bitcoin Grinds Lower as Buyers Absorb the Dips and the Bitcoin Treasury Narrative Cracks - July 2, 2026

Analyst Summary
The decline scenario we outlined in the previous issue played out: Bitcoin slid into the $58,200-$60,200 zone, with the drop driven by intensifying spot ETF outflows - $1.8 billion over the current reporting period versus $741 million a week earlier. Sentiment continued to deteriorate, with the Fear and Greed Index falling to 19. At the same time, the structural demand picture has grown noticeably stronger: market depth is at its highest since the start of 2025 and is filling up mainly with buy orders, whale bids remain denser than sell orders, and dips are being aggressively bought. The macro backdrop is also sending its first encouraging signals: oil has returned to the levels seen before the active phase of the Iran conflict, and ISM Manufacturing Prices has cooled - 73 versus 82.1 a month earlier - which already calls into question the long-term persistence of inflation. A separate theme of the week is Strategy's new capital framework, which formalizes a mechanism for potential Bitcoin sales and deals a blow to the Bitcoin Treasury narrative.
Key Market Snapshot
|
Asset |
7D Change |
Trend |
Analyst Bias |
|
BTC |
-1.5% |
Descending |
Cautiously-Bullish |
|
ETH |
-0.6% |
Descending |
Neutral |
|
Altcoins (TOTAL3ES on Tradingview) |
-0.1% |
Descending |
Neutral |
Last Week's Watchlist: What Happened?
- The decline scenario played out: Bitcoin is currently trading in the $58,200-$60,200 zone.
- Bitcoin ETF outflows intensified: around $1.8 billion over the current reporting period versus $741 million in the prior one. Institutional demand remains weak and continues to be the main source of pressure.
- The daily order book delta: after the June 25 decline, it moved mostly into positive territory.
- The ISM Manufacturing Prices Index came in lower than a month earlier: 73 in June versus 82.1 in May. This is a positive signal.
What Moved the Market This Week?
Over the reporting period, the most significant decline came on June 25 and was driven precisely by BTC-ETF outflows of more than $691 million. After the ISM Manufacturing Prices release, Bitcoin's price jumped back above $60,000, as the index came in below expectations and below the previous month's reading.
An important detail worth noting here: the buyers - specifically the whale bids we discussed in our previous reviews - immediately bought up these dips. The decline was slowed by large buy orders but nonetheless continued, due to long-position liquidations and selling from ETFs.
There was also negative news about attacks around Iran, but it had almost no impact on the market: participants interpret it as a show of force ahead of a new round of negotiations rather than as an escalation.
Sentiment continued to fall, but after the ISM index releases, it currently stands at 19. And, as we noted earlier, in the current situation the fear index on its own is not very telling. Far more important are the positive structural signals discussed below.
Market Depth: Buyers Are Quietly Returning
Chart: Order Book Depth And Cumulative Volume Delta
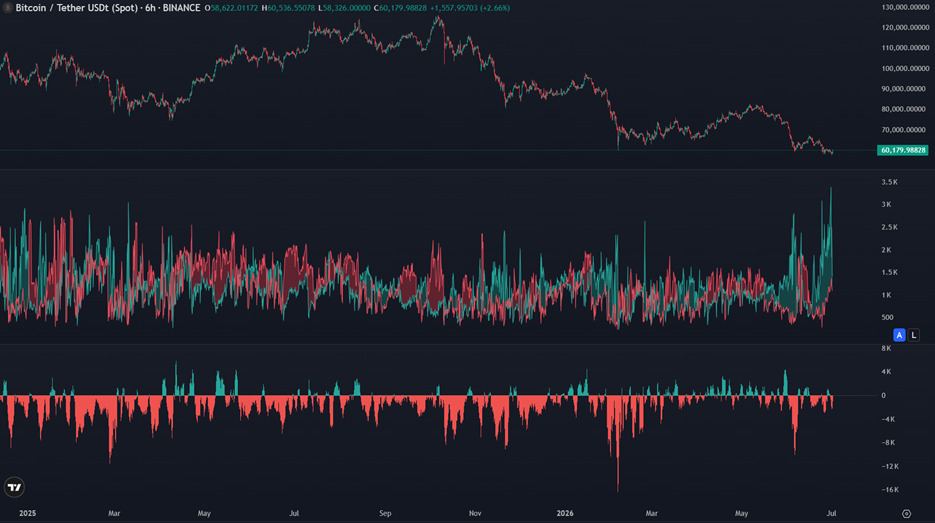
Chart source: trdr.io
Asset: BTC/USDT
Timeframe: 6 Hours
Metric: Order Book 5% Depth, Cumulative Volume Delta
Data checked: July 2, 2026, 08:00 UTC
We have already noted that whale buy orders are placed more densely than sell orders. That picture persists. And even though cumulative volume delta is still declining, signaling realized selling, market depth is growing actively - and the lion's share of that volume comes precisely from buy orders, and not only from whales.
As the chart shows, the market depth reading is currently at its highest since the start of 2025. Moreover, a comparable bid-to-ask delta was seen in September 2023 - ahead of the rally that began in October 2023.
Combined with the whale-bid readings and accumulation by long-term holders, this indicates that buyers are gradually returning to the market. Dips are being aggressively bought - which is exactly why price is not falling rapidly but is being held back. Selling pressure is still present but is gradually easing, and on this basis experts are leaning toward the view that a bottom is near.
Bitcoin and the Macro Backdrop: Is Inflation Really That Sticky?
Chart: Energy Prices Drive U.S. CPI and DXY
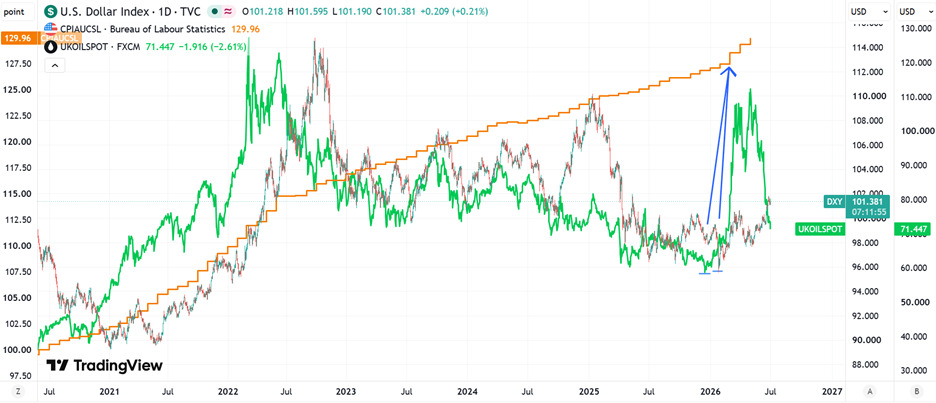
Chart source: TradingView
Asset/market: U.S. Dollar Index, U.S. CPI (indexed), Brent crude oil
Timeframe: Daily
Metric: DXY vs indexed CPI vs Brent crude oil price
Data checked: July 2, 2026, 08:00 UTC
Seller pressure is being sustained by a difficult macro backdrop driven by the Iran conflict and rising oil. But over a horizon of several months, the picture does not look so grim.
The chart shows the price of Brent crude oil as a driver of rising inflation and the dollar index (with the inflation measure indexed). It is clear that oil has already returned to the levels seen before the active phase of the Iran conflict. The dollar index changed trend in late January, and oil did so even earlier - in December 2025, when the conflict was still in a risk phase rather than a realized event.
The rise in oil on conflict expectations began to feed into the inflation index as early as the March data - that is, roughly 3-4 months after the increase began. This indicates that inflation may not be as persistent as commonly assumed, and the ISM Manufacturing Prices release partly confirmed this. A further decline in oil prices should slow inflation.
The open question is: how deeply has the rise in oil prices already seeped into the economy? Based on the logic of the chart, a decline in the dollar index and a slowdown in inflation should appear within three months. If that does not happen, it means inflation has become more entrenched. But the statistics of the past five years favor fast transmission: changes in oil prices have fed through fairly quickly into the dollar index and U.S. inflation. In this scenario, the key becomes monitoring the inflation-related economic releases.
What to Watch Next
The main thing is to watch price behavior and the order book on declines: if every dip continues to be actively bought, it means demand is becoming ever more resilient. The same logic should be applied to price rises - to gauge whether seller pressure is easing.
It is also important to keep tracking fund flows in ETFs: a significant slowdown in selling by the funds would be a good signal. And, finally, it is necessary to watch all available U.S. economic releases related to inflation, in order to assess how deeply inflation has seeped into the economy.
Analyst Opinion: Slow Grind Lower Until Selling Exhausts
Current view: as long as there is no broad-based positivity in sentiment, selling will most likely continue. The base case is that Bitcoin slowly grinds lower within a declining range of roughly $57,500-$59,500, with squeezes, until selling pressure exhausts itself completely or strong positive news on Iran emerges.
Rationale: the active flows still point downward - ETF outflows accelerated to $1.8 billion, long liquidations continue, and sentiment is at 19. But the downside potential is limited: market depth is at its highest since the start of 2025 and is filling up mainly with buy orders, whales are firmly buying the dips, and long-term holders continue to accumulate. This is the same structural thesis as in the previous issue: the market is more likely forming a bottom than beginning a new, deep downtrend.
Confirmation level: the conditions for a reversal remain the same - ETF selling needs to stop, retail selling pressure needs to ease, and Bitcoin needs to hold above $68,000 on the back of sustained buy-order activity.
Invalidation: if active selling begins from corporate treasuries - for example, Strategy - if ETF outflows intensify further, if the situation in Iran sharply worsens, or if seller pressure increases overall, Bitcoin risks moving below $55,000 and consolidating there. This would become a serious problem for Bitcoin treasuries due to the new accounting standards in the U.S.: under FASB ASU 2023-08, companies are required to carry Bitcoin at fair value, running the revaluation - both gains and losses - directly through net income. As long as the price is above the average purchase price, this works in their favor; but consolidating below it (a level estimated at ~$55,000 for some treasuries) would result in large losses on the income statement, pressure on capital and the premium to NAV, and a risk of forced selling.
Trading takeaway: in the current conditions, the priority is to track the shift in active flows: a slowdown in ETF selling, the resilience of dip-buying in the order book, and the first signs of disinflation in macro releases. Until these confirmations appear, the advantage remains with sellers, despite the strengthening demand structure below.
Scenarios for the Week Ahead
Neutral scenario. Bitcoin continues to slowly grind lower within the ~$57,500-$59,500 range, with squeezes to the upside. ETF selling and long liquidations persist, but growing market depth and whale bids cushion the dips, keeping price from collapsing. The market waits for a slowdown in outflows and for clarity on inflation and Iran.
Growth scenario. ETF outflows slow markedly or reverse into inflows, retail selling exhausts itself, and positive news on Iran and/or confirmed disinflation appears. In this case, the accumulated demand depth converts into a price recovery, and a sustained confirmation of a reversal would be a hold above $68,000.
Decline scenario. Selling from corporate treasuries or miners kicks in, ETF outflows intensify, or the Iran conflict sharply escalates. Seller pressure breaks through the demand level, and Bitcoin drops below $55,000 - which additionally hits treasuries through the mechanics of fair-value accounting and raises the risk of cascading sales.
In Focus: Michael Saylor and Strategy
The main corporate story of the week was Strategy's publication of its Digital Credit Capital Framework. The key provisions are as follows: a USD reserve of $2.55 billion, covering 17.4 months of dividend and interest payments - that is, $1.76 billion per year - against an established minimum of 12 months; an increase in the STRC dividend rate from 11.5% to 12% effective July 1, with a target corridor of $99-100; two $1 billion buyback programs; a Bitcoin monetization program of up to $1.25 billion to replenish the reserve, plus an open-ended limit on funding dividends and buybacks through Bitcoin sales; and a declaration of discipline in issuing common equity around an mNAV of 1x.
But it is essential here to separate declarations from obligations. The buyback programs explicitly state that they do not obligate the company to purchase any volume of securities and may be modified, suspended, or terminated at any time. The BTC Monetization Program does not obligate Strategy to sell Bitcoin. The minimum 12-month reserve can be lowered by a board decision. The STRC target of $99-100 comes with an explicit no-guarantee disclaimer, and the STRC dividends themselves remain at the board's discretion. Legally, only two things are fixed: the 12% STRC rate and the declared semi-monthly dividends on July 31 and August 15. Everything else is rhetoric. The takeaway is simple: Strategy will act tactically, and what needs to be studied is each subsequent 8-K filing.
The 0.5 percentage-point increase in the STRC rate is a compromise between supporting the security and keeping obligations under control, and it did not convince the market: the pullback in STRC to $79 means that, at that price, the fair yield should be closer to 15%, by experts' estimates.
For Bitcoin itself, the main effect is a blow to the structural narrative. Michael Saylor was the chief architect of the Bitcoin Treasury thesis, and when it is the architect himself who formalizes a mechanism for potential sales - and in such a market phase, no less - the narrative takes a serious hit. Strategy was the largest corporate buyer of Bitcoin, and its shift into the status of a potential seller is a structural change. There is also a positive side: there is now less uncertainty, and a defined, if unpleasant, scenario is better than none at all. The main risk is that other Bitcoin treasuries may follow Saylor and adjust their own strategies.
Risks for the Week Ahead
- An escalation of the Iran conflict and a fresh spike in oil prices, which could re-ignite inflation and prolong the risk-off regime.
- Inflation that has seeped into the economy more deeply than fast oil-transmission implies: if the DXY and inflation do not begin to cool over the next ~3 months, the disinflation thesis weakens.
- A further intensification of outflows from spot BTC and ETH ETFs.
- Selling from corporate treasuries - the launch of Strategy's BTC Monetization Program or sales by miners such as Marathon Digital.
- Bitcoin consolidating below $55,000, which - through fair-value accounting - would hit treasuries' financials and could trigger reflexive selling.
- A domino effect in the Bitcoin Treasury sector: the broken NAV-premium model at most companies raises the risk of forced deleveraging.
- Continued liquidations of long positions amid weak sentiment, with no dip-buying.
The main short-term risk is a coincidence of continued capital outflows with negative inflation data, which could push through demand levels precisely at a moment of extreme fear.
Watchlist for the Week
- Order book and market depth: the resilience of dip-buying and the behavior of sellers on rallies.
- Spot BTC and ETH ETF flows: a slowdown in selling as the first signal of a reversal.
- U.S. inflation-related economic releases: how deeply inflation has seeped into the economy.
- Brent crude price: a further decline should slow inflation and weaken the DXY.
- BTC levels: confirmation of a reversal - a hold above $68,000; the risk zone for treasuries - below $55,000, and the price reaction on a break out of the current range.
- Strategy filings (8-K): whether the BTC Monetization Program is actually used.
- Other Bitcoin treasuries: mNAV discounts and signs of following Strategy.
Final Takeaway
The decline scenario played out: Bitcoin slid into the $58,200-$60,200 zone under pressure from large ETF outflows and liquidations, and sentiment dropped to 19. Even so, the demand structure is strengthening - market depth is at its highest since the start of 2025 and is filling up with buy orders, whales and long-term holders are buying the dips, and the cooling in oil and ISM Manufacturing Prices calls the persistence of inflation into question; taken together, this points to a bottoming process. Over the weekly horizon, the base case is a slow grind lower within the $57,500-$59,500 range, with squeezes, until selling exhausts itself or positive news on Iran emerges; a sustained confirmation of a reversal remains a hold above $68,000, while the key downside risk is a consolidation below $55,000, painful for treasuries because of fair-value accounting. A separate structural factor is Strategy's new framework, which formalizes a mechanism for potential Bitcoin sales: this is a blow to the Bitcoin Treasury narrative, though for now the sector has taken a pause rather than shifting to active selling. Until the active flows change, the priority remains confirmation signals and risk management.
Methodology
This weekly update analyzes crypto market structure, technical indicators, liquidity and market-depth conditions, derivatives data, on-chain activity, and sentiment data through the lens of asset price changes, along with relevant macroeconomic, corporate, and regulatory developments. The analysis is based on data available at the time of publication and may change as new market information becomes available.
Disclaimer
This article is for educational and informational purposes only and does not constitute financial, investment, or trading advice. Crypto assets are volatile, and past performance is not a reliable indicator of future results. Always conduct your own research and consider your risk tolerance before making trading decisions.


.png)