Weekly Crypto Market Update: Bitcoin Loses Support Under Risk-Off Pressure as Traders Watch for an Altcoin Turn - June 25, 2026

The crypto market spent the week under risk-off pressure. The peace agreement between the United States and Iran was still not signed on June 19, although the situation in the Strait of Hormuz remains stable according to media reports. Against this backdrop, the sentiment index fell to 18 - the "extreme fear" zone - while spot ETF outflows intensified: -$741.6 million from Bitcoin funds and -$191.4 million from Ethereum funds. Bitcoin lost its key $62,000 support on Wednesday, June 24, due to a single large short order, and the daily order book delta moved into negative territory. That said, the selling is mostly restrained loss realization, and structural signals - such as dense whale bids down to $57,400 and the share of supply in profit at its lowest since 2020 - suggest that the downside potential may be limited.
Key Market Snapshot
|
Asset |
Weekly Change |
Trend |
Analyst Bias |
|
BTC |
-5% |
Descending |
Neutral |
|
ETH |
-6% |
Descending |
Neutral |
|
Altcoins (TOTAL3ES on Tradingview) |
-7% |
Descending |
Neutral |
Last Week's Watchlist: What Happened?
- BTC support at $62,000 - the level has now been broken, but whale orders cushioned the drop and brought price almost back into last week's range.
- Resistance at $66,500 - this week’s price did not return to it and did not even reach it. This signals weaker demand compared with last week.
- Order book delta - the buy-side skew has been lost; the delta shifted into the selling zone this week.
- Open interest - deleveraging continued; leverage is still being reduced.
- Spot BTC-ETF flows - outflows not only continued but intensified.
- UST10Y / DXY - risk-off persists; pressure on risk assets has not eased.
- Iran news - the peace treaty was not signed on June 19, but the Strait of Hormuz remains open, which contained the escalation of risks.
- Scenario outcome - the decline scenario largely played out: Bitcoin failed to hold $62,000 but quickly returned to the $61,000–$62,000 tactical zone.
What Moved the Market This Week?
The main theme of the week was the persistence of the risk-off regime. The anticipated peace agreement between the United States and Iran on June 19 did not materialize. This did not lead to fresh escalation - the Strait of Hormuz, according to media reports, remains stable - but it also failed to give the market the positive impulse participants had been counting on a week earlier. Geopolitical risk once again moved from "softened" back to "unresolved."
Sentiment reacted accordingly: the Fear and Greed Index fell to 18 - the extreme fear zone. This is traditionally a contrarian signal that often accompanies local lows, but on its own it is not confirmation of a reversal and can persist for an extended period, especially given the money flows in exchange order books and ETFs.
Capital continued to leave crypto ETFs. Outflows from spot Bitcoin funds amounted to -$741.6 million, and from Ethereum funds to -$191.4 million. Compared with the moderate outflows of the previous week, this is a notable acceleration and further confirmation that institutional demand remains weak.
Order Flow & On-Chain
The order-flow structure changed little over the week, but for the worse. Order Book Pressure remained static, while buy-order activity declined, according to CoinGlass - indicating that buyers have taken a wait-and-see stance. The daily order book delta at 1% depth is currently in negative territory and shows selling pressure, which nonetheless remains restrained. This is also confirmed by Looknode data: Bitcoin's circulating supply is concentrated around current price levels without significant changes.
Chart: Net Shorts And Net Longs
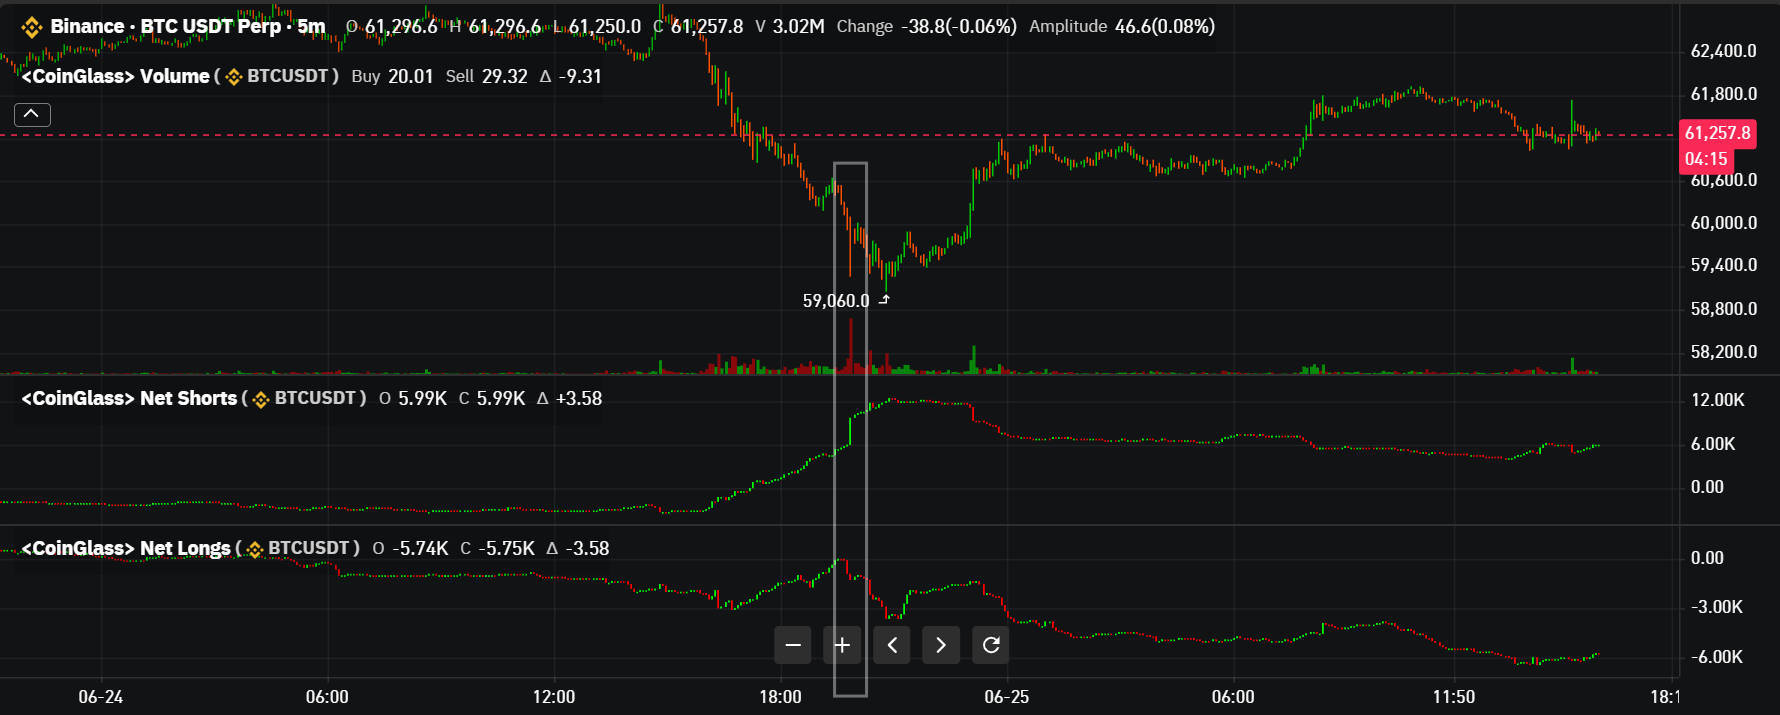
Chart source: CoinGlass
Asset: BTC
Timeframe: 5m
Metric: Net Shorts
Data checked: June 25, 2026, 01:22 PM UTC
The structure was broken by a short position of more than 3,500 BTC; this position was opened with a market order, and such trades cannot be anticipated - they break the structure and trigger a wave of liquidations. Fortunately, the volume of long-position liquidations turned out to be relatively small, at $210 million. This means that the orders concentrated below current levels are mostly spot orders, which is very encouraging for those expecting Bitcoin to rise. Thanks to the whale orders we discussed in last week's review, market participants bought up this drop almost entirely.
Even so, the selling we observe in the order book delta is still loss realization. This is indicated by the realized profit and loss data: realized losses still exceed realized profits. In other words, the market is dominated not by confident sellers but by capitulating holders in the red.
Bitcoin and the Macro Backdrop
Chart: 100-Days Rolling Correlation With BTC
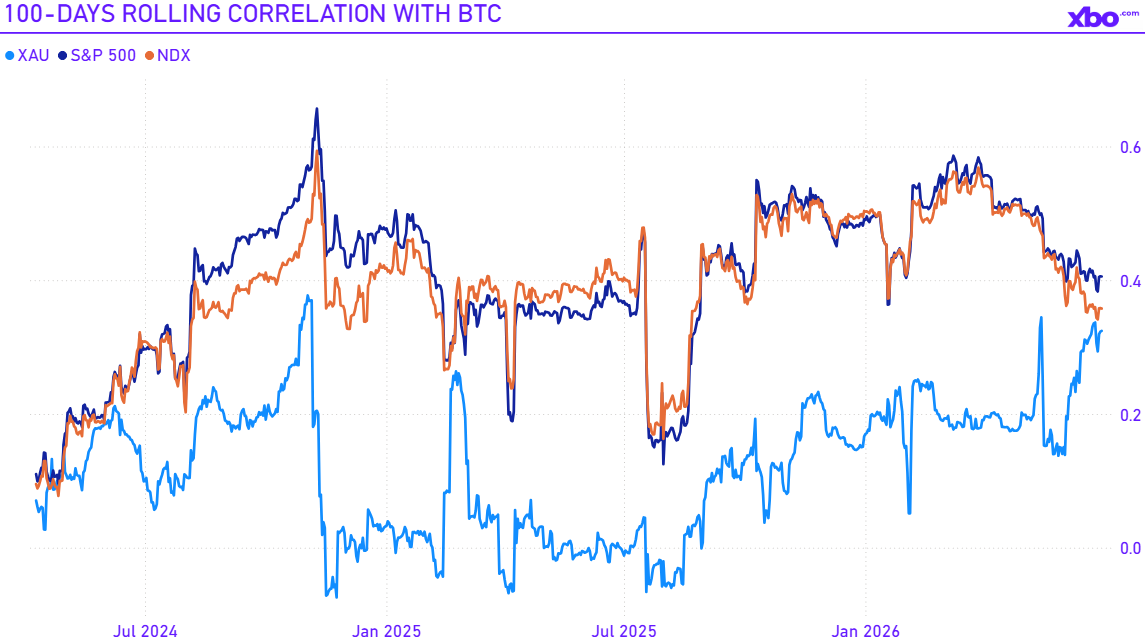
Data source: Investing, Nasdaq, XBO.com
Asset: BTC, XAU, S&P 500, Nasdaq-100 (NDX)
Timeframe: Daily
Metric: Rolling correlation coefficient
Data checked: June 25, 2026, 01:22 PM UTC
In July, the U.S. corporate earnings season begins. Expectations for the earnings of the largest companies are rather positive; however, a likely rally in stocks will, in all likelihood, not help Bitcoin recover until the pressure from capitulating sellers eases and the conflict between the United States and Iran comes to an end. The reason is that, by our calculations, the 100-day rolling correlation between Bitcoin and stock-market assets continues to decline. In other words, the usual "tailwind" for crypto from rising equity markets is now noticeably weaker, because crypto-market participants are focused on geopolitics and on the cash flow within the market, and a rise in stocks for reasons unrelated to crypto is unlikely to become a tailwind for Bitcoin the way it used to.
On the other hand, there is also a structurally positive signal. The share of Bitcoin supply in profit has dropped to 47% - the lowest since 2020. Historically, when few coins remain in profit, selling pressure gradually exhausts itself, because by this point the metric mainly captures long-term holders, who instead add to their positions on such declines and will not sell. This is one of the signs that a bottom is near. It is confirmed by Looknode data - long-term holders have already accumulated more than 16.63 million BTC, an all-time record.
That said, one should not forget the broader macro backdrop. The trend toward monetary policy tightening is gaining momentum among the world's central banks, according to Bloomberg. This means that the dollar and a number of other national currencies will tend to strengthen, supporting the risk-off regime in cryptocurrencies over the course of this year. Much will also depend on the activity of Strategy and other corporate Bitcoin buyers - their demand remains one of the few potential sources of support.
What to Watch Next
In this respect, experts will be watching the U.S. ISM Manufacturing Prices Index, which is due to be released next week. This indicator reflects the prices manufacturers pay for raw materials and components and is considered a leading indicator of inflation: rising input prices feed through into consumer prices with a lag. Given that the Fed explicitly pointed to the persistence of inflation at its last meeting, a "hot" reading of this index would reinforce the "higher for longer" narrative, push yields and the dollar higher, and add pressure on crypto. That is why ISM Prices is currently one of the nearest catalysts for rate expectations - not counting the surprises characteristic of the current Iran conflict.
Analyst Opinion: Short-Term Bias Lower, Downside Likely Capped
Current view: a downward bias over the weekly horizon. Bitcoin is trading near $61,100, and until demand returns to the market, the base case is a decline or a downward-drifting range rather than a reversal. At the same time, the downside potential is most likely capped by the zone of whale bids below current levels. This means the market is in the process of forming a bottom, rather than at the start of a new, deep downtrend. This is a thesis spanning several weeks, and it requires confirmation through a return of demand - it is not a call to expect a rally soon.
Rationale: the active flows point downward - extreme fear, accelerating ETF outflows, a negative order book delta, and the break of $62,000 by a large short order. But the reaction to that break showed that the demand concentrated below is mostly spot: long liquidations were relatively small at ~$210 million, and whale bids bought up the drawdown almost entirely. Combined with record accumulation by long-term holders - more than 16.63 million BTC - and the share of supply in profit at its lowest since 2020, this limits the depth of the decline but does not remove the short-term pressure.
Confirmation level: ~$68,000. After the $62,000 structure was broken and $66,500 was not even tested this week, the bar for a confirmed reversal has shifted higher. A sustained reversal in traders' eyes will now require a move into the ~$68,000 area - a simple return to the previous range is no longer enough for confirmation.
Invalidation: if there is no positive news on Iran, the ISM comes in too "hot," and ETF outflows and the selling skew in the order book intensify significantly, Bitcoin will most likely continue its decline into the broad $58,500–$60,000 zone.
Trading takeaway: in the current conditions, the priority is not to guess the bottom amid extreme fear but to wait for a change in the active flows: a reversal of ETF outflows into inflows and a return of the order book delta to buying. Until these signals appear, the advantage remains with sellers, despite the strong demand structure below.
Scenarios for the Week Ahead
Growth scenario (least likely, but possible). Positive news on Iran emerges and/or the ISM comes in soft, and selling pressure eases: ETF outflows reverse into inflows, and the order book delta returns to buying. Only in this case is an upside reversal possible, and its sustained confirmation will now require Bitcoin to reach the zone above ~$68,000, rather than a simple return to the previous range.
Neutral scenario. Bitcoin remains in a declining trend within the $60,000–$61,500 zone. Loss realization continues and whales buy up the dips, but there is no sustained demand for a reversal - the market slowly drifts lower within the range, with small upward bounces that get absorbed by capitulating sellers, while waiting for clarity on inflation and geopolitics.
Decline scenario. If there is sharp negative news on Iran, the ISM aggravates the inflationary narrative, and ETF outflows and the selling skew in the order book intensify, Bitcoin will continue its decline into the broad $58,500–$60,000 zone, where the next layer of demand is located.
Altcoin Watch: An Approaching Altseason Signal Meets a Liquidity Problem
Glassnode analysts expect an altseason to begin in the near term. The "Altcoin Cycle Signal" indicator is currently at 86% - a level that has historically preceded strong growth in altcoins relative to Bitcoin.
This time, however, the signal is not "classic." Altcoins usually rise on the back of a strong influx of demand. Now the logic is different: after almost two years of sell-offs, selling pressure in altcoins is nearly exhausted - meaning growth is more likely to come "from the absence of sellers" than "from the arrival of buyers." This is also confirmed by the weak price action: despite the indicator's high reading, the total altcoin market cap has fallen by 6% since June 18.
The main problem is the lack of inflows into stablecoins. Over the quarter, the combined supply of the top 6 stablecoins by market cap shrank by $5.4 billion. This matters for two reasons. First, it is another indicator of risk-off in crypto. Second, it is precisely stablecoins that provide the liquidity needed for altcoin growth - and that liquidity is shrinking. According to experts' estimates, the outflow is mainly tied to loss realization.
Almost the only supporting factor right now is inflows into spot altcoin ETFs. Over the past week they amounted to $46 million, mainly thanks to the HYPE-ETF (+$27.9 million), XRP-ETF (+$10.6 million), and SOL-ETF (+$7.8 million).
For this combination of reasons, many experts - despite Glassnode's indicators - do not yet expect broad altcoin growth. Growth is possible mainly in individual sectors, but which ones will become the leaders is hard to say at this stage.
Risks for the Week Ahead
- A breakdown or stalling of the U.S.–Iran peace track and any destabilization around the Strait of Hormuz - this could trigger a spike in energy prices and a fresh inflationary impulse.
- A "hot" reading of the U.S. ISM Manufacturing Prices Index, reinforcing the narrative of persistent inflation and "higher for longer."
- The global trend toward monetary policy tightening and the associated strengthening of the dollar, supporting risk-off in crypto.
- A continuation and acceleration of outflows from spot BTC and ETH ETFs.
- Mass capitulation by Bitcoin holders in the red.
- A further reduction in stablecoin liquidity, limiting any altcoin growth.
- A slowdown or halt in the activity of Strategy and corporate buyers as one of the few sources of demand.
The main short-term risk is the coincidence of weak demand with a tough macro backdrop, which could intensify pressure on the market precisely at a moment of extreme fear.
Watchlist for the Week
- Order book flow: a build-up of selling pressure or the appearance of new large market orders.
- BTC resistance: $68,000 - the zone where large sell orders are concentrated.
- Spot BTC and ETH ETF flows: a reversal of outflows into inflows.
- BTC realized profit/loss: a reduction in the prevalence of losses.
- U.S. ISM Manufacturing Prices Index: the nearest inflation signal.
- Stablecoin liquidity and altcoin ETF inflows: a precondition for altcoin growth.
- Growth of individual cryptocurrencies: matching rising tokens with their sectors - this may hold the answer to which sectors are promising.
- Altcoin Cycle Signal (Glassnode): holding or rising above the 86% level.
Final Takeaway
This week Bitcoin lost the $62,000 support and is trading near $61,100, while the active flows - extreme fear, accelerating ETF outflows, and a negative order book delta - keep the short-term advantage with sellers. Even so, the reaction to the break showed the strength of demand below: relatively few longs were liquidated, whale bids bought up the drawdown, and record accumulation by long-term holders, together with the share of supply in profit at its lowest since 2020, suggests that the decline is most likely capped around the $57,000–$58,000 zone, and that the market is going through a bottoming process. Over the weekly horizon, the base case is a decline or a downward-drifting range: in the absence of positive news on Iran, with a "hot" ISM and continued ETF outflows, price risks sliding into the $58,500–$60,000 zone, whereas a sustained confirmation of a reversal will now require nothing less than a move into the ~$68,000 area. Until the active flows change - a reversal of ETF outflows into inflows and a return of the delta to buying - the priority remains confirmation signals and risk management, rather than attempts to guess the bottom amid extreme fear.
Methodology
This weekly update analyzes crypto market structure, technical indicators, liquidity conditions, derivatives data, on-chain activity, and sentiment data through the lens of asset price changes, along with relevant macroeconomic and regulatory developments. The analysis is based on data available at the time of publication and may change as new market information becomes available.
Disclaimer
This article is for educational and informational purposes only and does not constitute financial, investment, or trading advice. Crypto assets are volatile, and past performance is not a reliable indicator of future results. Always conduct your own research and consider your risk tolerance before making trading decisions.


.png)