


Weekly Crypto Market Update: Bitcoin Climbs on Spot Demand and Eyes $68,000 as Big-Tech Earnings Loom - July 23, 2026

Analyst Summary
Bitcoin has been climbing for most of the week and is currently trading around $65,500, after reaching a weekly high of $66,958 on July 21. Ethereum has followed Bitcoin's lead and is now trading near $1,920, with a weekly high of $1,953. Market sentiment has improved to 39, gradually moving out of the Fear zone. The key takeaway this week is that Bitcoin continues to rally largely independently of the broader macroeconomic backdrop.
Oil prices have climbed above $90 per barrel, and tensions in the Strait of Hormuz remain elevated. However, the crypto market has so far shown little reaction. Instead, the current rally is being driven by steady spot buying and growing optimism ahead of earnings reports from major U.S. technology companies, particularly those with significant exposure to artificial intelligence. Spot Bitcoin ETFs have now recorded seven consecutive days of net inflows, providing additional support for the market.
That said, inflationary risks stemming from higher oil prices have not disappeared and are likely to re-emerge in the August inflation data. For now, Bitcoin remains confined to the $63,000-$67,000 range and is likely to test the upper boundary of that range in the near term.
Key Market Snapshot
|
Asset |
7D Change |
Trend |
Analyst Bias |
|---|---|---|---|
|
+2.5% |
Ascending |
Cautiously-Bullish |
|
|
+2.6% |
Ascending |
Cautiously-Bullish |
|
|
Altcoins (TOTAL3ES on Tradingview) |
+0.9% |
Range |
Neutral |
Last Week's Watchlist: What Happened?
- Price Action & Order Book: Dips on July 17 and July 20 were bought aggressively throughout the day, highlighting strong spot demand.
- Spot ETF Flows: Spot Bitcoin ETFs have recorded continuous net inflows since July 14, attracting a total of $999 million over the period.
- Oil Prices & U.S. Strategic Petroleum Reserve: The U.S. government added 2 million barrels to the Strategic Petroleum Reserve, while oil prices climbed and are now holding above $90 per barrel.
- Iran & the Strait of Hormuz: Tensions remain elevated, but Bitcoin has so far shown little reaction to the ongoing conflict.
- BTC Price Levels: Bitcoin advanced for most of the week but has yet to reach $68,000. A short-term pullback remains possible, although any correction is likely to be relatively shallow.
Positioning: Whale Order Books and Friday's Options Expiry
Chart: BTC Whale Orders & Large Trades
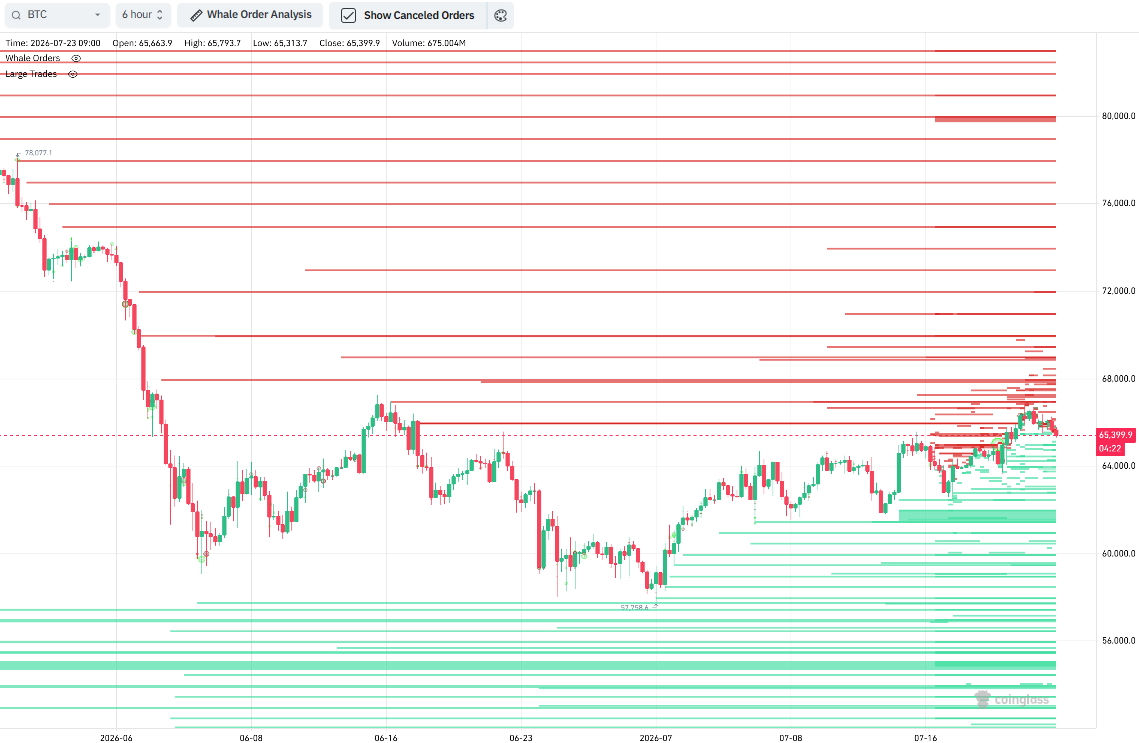
Chart source: CoinGlass
Asset: BTC
Timeframe: 6H
Metric: Whale Orders and Large Trades
Data checked: July 23, 2026, 09:00 UTC
On crypto exchanges and spot markets, large players have built a strong buy-side support zone between $60,000 and $64,000, while the entire cluster of buy orders in the $59,000-$62,000 range has strengthened over the past week. Sell-side liquidity between $66,000 and $68,000 has also increased, although the overall volume remains lower, with part of the sell wall having shifted above $70,000.
The strongest near-term support is concentrated around $62,500-$63,000, which is clearly visible on lower timeframes. From a broader perspective, however, the most important defensive level is located near $61,000. These buy-side order clusters will be the key levels to monitor, especially during any price pullbacks.
Overall, the order book suggests that bulls are committed to defending Bitcoin above $65,000, while bearish selling pressure continues to weaken.
In the derivatives market, funding rates remain close to neutral, indicating that neither long nor short positions are currently overcrowded. At the same time, open interest continues to rise, reflecting growing market participation rather than excessive leverage.
Another important catalyst is the options expiration on Friday, July 24. Between $68,000 and $70,000, market makers remain in a short gamma position. This means that if Bitcoin continues to rise, dealers are likely to buy additional futures to maintain their hedges, reinforcing upward momentum. Above $70,000, gamma exposure flips to long, making dealers more likely to sell into strength, which could dampen further upside.
What to Watch Next
The key focus is how price behaves around major support and resistance levels, as well as changes in the order book. On pullbacks, watch the strength of the buy-side liquidity at $62,500-$63,000 and, more importantly, around $61,000. If intraday dips continue to be bought aggressively, it will signal that spot demand remains resilient. On the upside, monitor the $67,000-$68,000 resistance zone to see whether significant sell-side liquidity emerges. If Bitcoin breaks above $68,000, pay close attention to open interest and spot trading volumes. Together, they will help determine whether the breakout is supported by genuine spot demand or driven primarily by leveraged positioning. Spot Bitcoin ETF flows should also remain a key indicator to watch.
The week's biggest catalysts will be earnings reports from major U.S. technology companies, which are likely to have a significant impact on overall risk sentiment and, by extension, Bitcoin. On July 22, Alphabet and Tesla reported stronger-than-expected results. Microsoft and Meta are scheduled to report on July 29, followed by Apple and Amazon on July 30. Strategy is also set to release its earnings on July 30. While expectations are generally positive, surprises remain possible. As always, developments in the oil market and tensions involving Iran remain important macro risks to monitor.
Analyst Opinion
Current view: Bitcoin is likely to challenge the $67,000-$68,000 resistance zone, with earnings reports from major U.S. technology companies serving as the most immediate catalyst. If earnings remain strong and spot demand continues to hold up, a breakout above this range becomes the base-case scenario. This is further supported by dealer positioning, as short gamma below $70,000 could amplify upside momentum. Overall, the outlook remains cautiously bullish.
Rationale: The current rally is being driven primarily by spot demand rather than leveraged speculation. Funding rates remain close to neutral, intraday pullbacks continue to be bought aggressively, and spot Bitcoin ETFs have recorded seven consecutive days of net inflows. Large buyers have also reinforced the $60,000-$64,000 buy zone, while overhead supply remains relatively light, with part of the sell-side liquidity having shifted above $70,000. This reduces the probability of a meaningful pullback before Bitcoin attempts to break through the $67,000-$68,000 resistance area.
Confirmation level: A sustained move above $68,000, supported by rising spot trading volumes, would open the way toward the $69,000-$70,000 range. A convincing close above that area would provide stronger confirmation that the broader uptrend has resumed.
Invalidation: A loss of the key support around $61,000, disappointing earnings from major technology companies, or another sharp rise in oil prices and U.S. Treasury yields could reverse the current momentum. It is also worth noting that oil prices and tensions involving Iran affect Bitcoin indirectly, primarily through their impact on U.S. Treasury yields, as higher yields tend to create a less favorable environment for risk assets.
Trading takeaway: As long as spot demand remains the dominant market driver, the priority is to confirm the strength of the move with objective signals: rising spot volumes on a breakout, continued ETF inflows, and the market's reaction to corporate earnings. Until Bitcoin secures a sustained break above $68,000, the current advance should be viewed as a test of the trading range rather than a confirmed breakout, making the $61,000-$63,000 support area especially important to monitor on any pullbacks.
Scenarios for the Week Ahead
Neutral scenario. Bitcoin remains confined to the $63,000-$67,000 range. Pullbacks continue to attract buyers, while the market consolidates ahead of earnings from major U.S. technology companies. Elevated oil prices and tensions involving Iran keep overall risk sentiment in check, but they have yet to exert meaningful direct pressure on Bitcoin.
Bullish scenario. Earnings from major technology companies come in strong, with no negative surprises related to AI spending or capital expenditure guidance. Spot demand remains robust, allowing Bitcoin to break above the $67,000-$68,000 resistance zone. With limited sell-side liquidity and dealers remaining short gamma below $70,000, a gamma squeeze could accelerate the rally toward the $69,000-$70,000 range.
Bearish scenario. Earnings disappoint, or oil prices and U.S. Treasury yields rise sharply, renewing pressure on risk assets. Bitcoin pulls back, but the dense concentration of whale buy orders between $60,000 and $64,000 is likely to limit the downside. The key strategic support remains around $61,000.
In Focus: A Low-Cost Chinese AI Model and the Bigger Question for Nvidia and Bitcoin
Moonshot AI has unveiled Kimi K3, a 2.8-trillion-parameter model with a context window of up to one million tokens. According to the company's benchmarks, it outperforms Claude and GPT on coding tasks. More importantly, the model is free and open-weight, allowing developers to download it, run it on their own infrastructure, and fine-tune it without paying the vendor. A full release is scheduled for July 27.
If these performance claims hold up, the implications could be significant. It would challenge the core assumption that cutting-edge AI will remain scarce - the very narrative underpinning much of today's investment thesis around AI chips, data centers, and, indirectly, Bitcoin.
To understand why, it's worth starting with economics. Inference costs - the price of generating one million tokens - have been falling by roughly an order of magnitude each year while maintaining comparable model quality. A GPT-4-class model costs around $60 per million output tokens in 2023. By 2026, comparable performance is expected to cost just fractions of a dollar - a decline of nearly 99.7% in only three years.
In other words, every token generated is becoming less profitable for AI providers, and free, open-weight models like Kimi K3 only accelerate that pricing pressure.
At the same time, capital spending on AI infrastructure continues to reach record highs.
Chart: AI-attributable Spending By Company
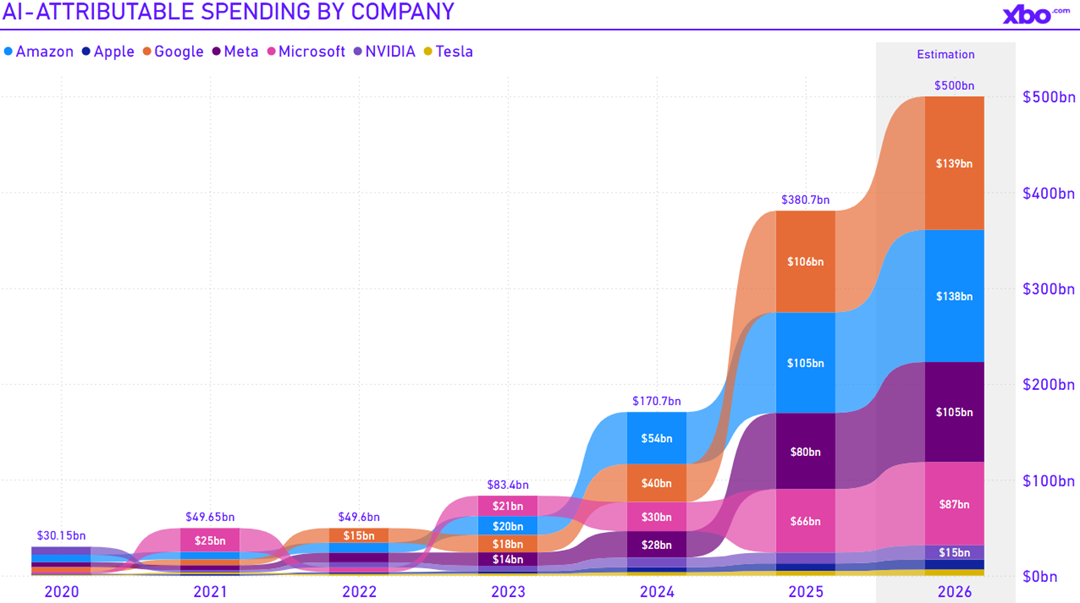
Chart source: Value Add VC
Asset: USD
Timeframe: Yearly
Metric: AI-attributable Spending
Data checked: July 23, 2026, 09:00 UTC
The chart illustrates how estimated AI spending by the seven largest corporate AI investors - Amazon, Apple, Google, Meta, Microsoft, Nvidia, and Tesla - has surged from virtually zero to hundreds of billions of dollars annually by 2025. For context, the four largest hyperscalers alone - Amazon, Google, Microsoft, and Meta - are expected to spend roughly $410 billion on AI throughout 2025.
Now compare those investments with the revenue they generate - and this is where the picture becomes more interesting. The gap is most evident among the pure-play AI labs. OpenAI, with an annualized revenue run rate of around $24-25 billion, has raised approximately $190 billion in capital, committed to more than $500 billion in computing infrastructure, and is estimated to be losing around $14 billion annually. Anthropic, with an estimated revenue run rate of $30-47 billion, has raised between $87 billion and $132 billion, according to various estimates. Meanwhile, hyperscalers such as Amazon, Google, Microsoft, and Meta report hundreds of billions of dollars in annual revenue, but only a small portion comes directly from AI. Their core profits still come from businesses like e-commerce, digital advertising, and cloud services, which are effectively subsidizing today's massive AI infrastructure build-out.
At the other end of the spectrum is Nvidia - the only participant in the AI value chain generating consistently strong profits. Notably, the company doesn't own data centers itself. Instead, it supplies the GPUs, networking hardware, and software that power them. Its Data Center segment now generates roughly $75 billion in quarterly revenue with gross margins of around 75%. Put simply, Nvidia is profiting from the AI build-out itself, while many of the companies funding that build-out have yet to make it financially viable.
The scale of this imbalance is reinforced by independent research. According to Sequoia, the AI ecosystem would need to generate roughly $600 billion in annual revenue to justify the current pace of investment, and around $3 trillion cumulatively to support the entire infrastructure build-out since the launch of ChatGPT. Allianz estimates that the gap between capital expenditures and AI-related revenue has reached 46% - wider than during the telecom bubble in 2001. Meanwhile, an MIT study found that 95% of enterprise AI pilot projects have yet to deliver measurable profit improvements.
The way this expansion is being financed is equally important. A significant portion of AI infrastructure spending is debt-funded. The technology sector issued a record $428 billion in bonds during 2025, while some companies, such as cloud provider CoreWeave, have been forced to borrow at junk-bond yields of around 11.5%. That changes the economics entirely. The break-even point is no longer fixed - it rises over time as debt servicing costs accumulate, turning the required revenue into a constantly moving target.
Why This Matters for Nvidia and Bitcoin
Putting the pieces together, the market has been pricing in an expensive assumption: that cutting-edge AI will remain scarce, making today's massive capital spending economically justified. Kimi K3 challenges that premise. If state-of-the-art performance can be achieved at a fraction of the cost and deployed on privately owned infrastructure, investors will inevitably begin asking whether the industry really needs to keep spending at its current pace.
As we've shown, AI investment is already far outpacing AI-generated revenue, with a meaningful share of that expansion financed by debt. And because debt servicing costs compound over time, the break-even threshold continues to move higher. In that environment, any reassessment of the "how many chips do we actually need?" narrative is likely to hit the asset most exposed to AI infrastructure demand: Nvidia. Its Data Center business now accounts for roughly 92% of total revenue, making the company highly sensitive to any slowdown in AI infrastructure spending. We've already seen how quickly that can play out. Following the release of DeepSeek in January 2025, Nvidia shares plunged 17% in a single trading session, wiping out a record $589 billion in market value, while Bitcoin fell 6-7%.
This is where the connection to crypto becomes important. Under normal market conditions, Bitcoin's correlation with technology stocks has been gradually weakening. But during periods of major AI-driven market shocks, correlations tend to spike as investors reduce exposure to risk across the board. A broad selloff in AI-related equities can therefore spill over into Bitcoin as well.
That said, this is also the point where it's important not to confuse a short-term market reaction with the longer-term economic picture. Following the DeepSeek-driven selloff, Nvidia not only recovered its losses but went on to reach new all-time highs. The reason is straightforward: as AI became cheaper, adoption accelerated, driving higher overall demand for computing power. This is a classic example of Jevons Paradox - when a resource becomes cheaper, total consumption often increases rather than declines.
The key question, therefore, isn't whether AI models become less expensive. It's whether demand for AI grows faster than the cost of generating each LLM token falls. If it does, lower pricing is offset by higher usage, meaning cheaper AI ultimately accelerates adoption rather than undermining the industry's economics.
None of this should be viewed as a doomsday scenario. Rather, it's a reminder to understand where the money is actually being spent - and where it ultimately flows. The flow is fairly predictable. Capital moves downstream through the AI value chain: from AI labs that are still burning through investor funding to chip and memory suppliers, power providers, data center developers and operators, lenders collecting interest payments, and ultimately end users benefiting from dramatically lower inference costs.
The central question now is whether AI adoption will grow fast enough to offset the relentless decline in token pricing. If it does, the gap between investment and revenue will be closed through volume rather than higher prices, and inexpensive open-weight models like Kimi K3 will accelerate AI adoption instead of undermining the industry's economics. For Nvidia, that outcome may be far less threatening than it initially appears. The company doesn't own data centers - it supplies the chips, networking hardware, and software that power them. As long as overall demand for computing continues to rise, Nvidia stands to benefit under almost any scenario, alongside memory manufacturers, power infrastructure providers, and data center operators.
Risks for the Week Ahead
- Further gains in oil prices above $90, including the Goldman Sachs scenario that projects Brent crude above $120 by year-end if disruptions in the Strait of Hormuz persist.
- Rising U.S. Treasury yields driven by higher oil prices and geopolitical tensions involving Iran. This remains an indirect but important channel of pressure on risk assets, including Bitcoin.
- Disappointing earnings from major U.S. technology companies, which could weaken overall risk sentiment.
- Delayed inflationary pressures, as the impact of higher oil prices is likely to be reflected in August inflation data.
- Elevated volatility surrounding Friday's options expiration.
The primary short-term risk is a combination of disappointing corporate earnings and another sharp rise in oil prices and U.S. Treasury yields at a time when Bitcoin's rally is being driven by sentiment and spot demand rather than macroeconomic tailwinds.
Watchlist for the Week
- Earnings reports from major U.S. technology companies: Alphabet and Tesla (July 22); Microsoft and Meta (July 29); Apple and Amazon (July 30).
- Strategy earnings report: July 30, after the market closes.
- Options expiration: Friday, July 24, with dealers remaining short gamma below the $68,000-$70,000 range.
- Bitcoin price levels: resistance at $67,000-$68,000 and $70,000; support at $62,500-$63,000, with strategic support around $61,000.
- Open interest and funding rates: watch for signs of excessive leverage if Bitcoin breaks higher.
- Spot Bitcoin and Ethereum ETF flows: continued inflows would reinforce the bullish outlook.
- Brent crude oil and U.S. Treasury yields: monitor whether oil holds above or falls below $90, along with the corresponding reaction in bond yields.
- Iran and the Strait of Hormuz: watch for signs of either escalation or de-escalation.
Final Takeaway
Bitcoin spent most of the week advancing on the back of improving market sentiment and strong spot demand rather than supportive macroeconomic conditions. It is currently trading around $65,980, spot Bitcoin ETFs have continued to attract steady inflows, and intraday pullbacks have been consistently bought.
Large market participants have reinforced the buy-side liquidity between $60,000 and $64,000, while overhead supply remains relatively light. At the same time, dealer positioning below $70,000 remains short gamma, which could amplify upside momentum if Bitcoin continues to rally. As a result, any near-term pullback is likely to remain relatively shallow, while a test of the $67,000-$68,000 resistance zone appears increasingly likely.
The next major catalyst will be earnings from major U.S. technology companies. If results are broadly positive, a sustained break above $68,000 could pave the way toward the $69,000-$70,000 range.
At the same time, risks remain. Oil prices above $90 and tensions involving Iran continue to influence the market indirectly through higher U.S. Treasury yields, while the inflationary impact of elevated energy prices is likely to become more apparent in August. Until Bitcoin establishes a convincing move above $68,000, the focus should remain on confirmation signals - spot trading volumes, continued ETF inflows, and the market's reaction to corporate earnings - while maintaining disciplined risk management around key support levels.
Methodology
This weekly update analyzes crypto market structure, technical indicators, liquidity and market depth, derivatives positioning, options and liquidation data, on-chain activity, and market sentiment alongside asset price performance. It also incorporates relevant macroeconomic, corporate, and regulatory developments. The analysis is based on information available at the time of publication and may change as new market data emerges.
Disclaimer
This report is provided for educational and informational purposes only and should not be considered financial, investment, or trading advice. Cryptocurrency markets are highly volatile, and past performance is not indicative of future results. Always conduct your own research and carefully assess your risk tolerance before making any investment or trading decisions.



.png)