


Q2 2026 in Focus: Macro Forces, BTC Redistribution, and Sector Winners

Introduction
In Q2 2026, nearly every asset class declined at once, and that, in itself, is the clearest indicator of the quarter's nature. Bitcoin fell 14%, Ethereum lost 25%, and the altcoin basket dropped 11%. The most telling behavior, however, came from gold: tokenized gold (XAUT), which had stayed positive for three consecutive quarters and served the market as a safe-haven asset throughout the correction, turned negative, falling 14%. When even a traditional hedge declines, the cause usually lies not within the market itself, but outside it.
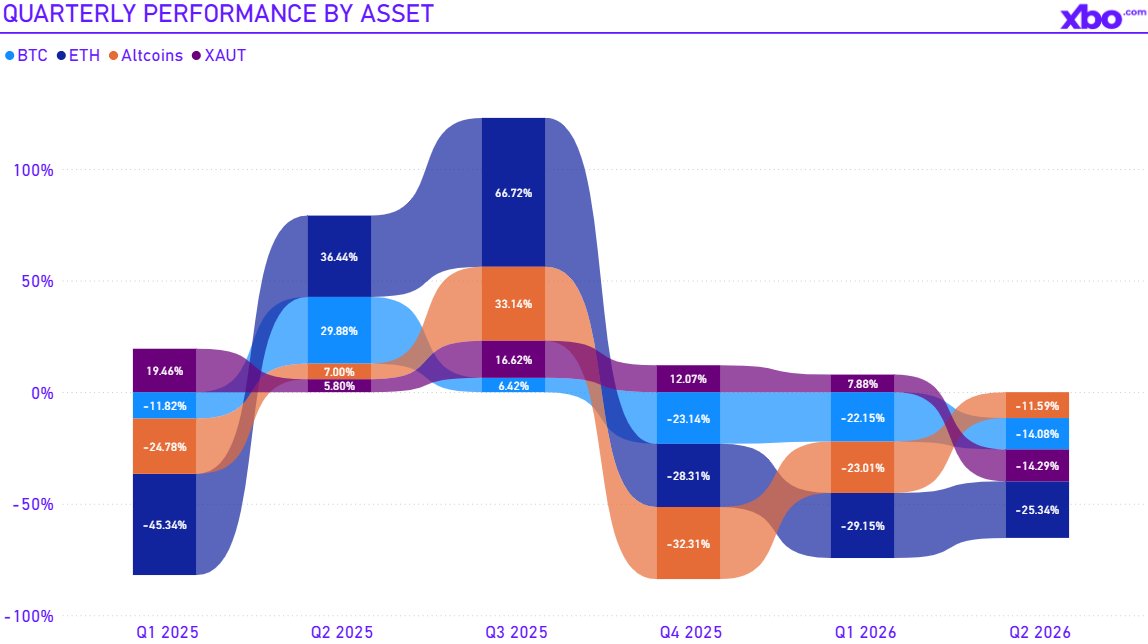
Source: https://www.xbo.com/platform/home, www.tradingview.com
This is exactly what defined the quarter. The trigger was external rather than crypto-specific: an oil shock stemming from the conflict with Iran, which reset inflation expectations and the trajectory of the Fed's policy rate. From there, the effect moved along a chain: macro conditions hit Bitcoin, which triggered sector rotation within crypto, which in turn impacted stablecoin liquidity.
Key Takeaways from Q2 2026
- The drawdown was driven by an external shock, not by the crypto market. The conflict with Iran and the closure of the Strait of Hormuz drove Brent from ~$65–$70 to a peak of $138; the inflation spike flipped expectations for Fed policy from "when will they cut?" to "will they be forced to hike?"
- What hit the market was the price of money, not its quantity. The Fed's net liquidity did not contract over the quarter, as the drain of the RRP facility offset QT. The market was brought down by the rising cost of capital and a high policy rate. The "liquidity drained out" thesis is not supported by the data.
- Every major asset ended in the red, including gold. XAUT turned negative for the first time in three quarters, which demonstrates how broad the shock was. Bitcoin and the wider altcoin basket proved more resilient than Ethereum.
- Bitcoin was redistributed toward "strong hands." ETFs and funds offloaded 105,335 BTC, short-term holders capitulated, and realized losses exceeded $18 billion, while long-term holders raised their share to 83% of supply, nearly matching the all-time high.
- Public companies accelerated their Bitcoin accumulation. Corporate treasuries added more than 100,000 BTC (+8.6% QoQ versus +5.8% the prior quarter), reaching 1,264,916 BTC; private companies and governments remained static.
- Sector rotation favored decentralization, privacy, and real-world assets: the leaders were Perp DEX, Privacy Coins, and RWA. The Bridge sector ended up as the laggard amid a record wave of hacks.
- RWA shifted into a consolidation phase. Total value reached ~$31.9 billion, but quarterly growth slowed to +7.5%, with tokenized US government debt remaining the sector's foundation.
External Shocks: The Macro Engine of the Quarter
The second quarter of 2026 was shaped not by internal crypto market dynamics but by a supply shock. The escalation of the conflict with Iran and the disruption of shipping through the Strait of Hormuz, through which roughly a fifth of the world's seaborne oil passes, triggered what the IEA described as one of the largest supply disruptions in the history of the oil market. Brent crude, trading at around $65–$70 per barrel at the start of the year, more than doubled by early April, reaching a peak of $138, and held above $100 until nearly mid-May. Only toward the end of the quarter, as a 60-day framework ceasefire took effect, did the price pull back to the $75–$80 range.
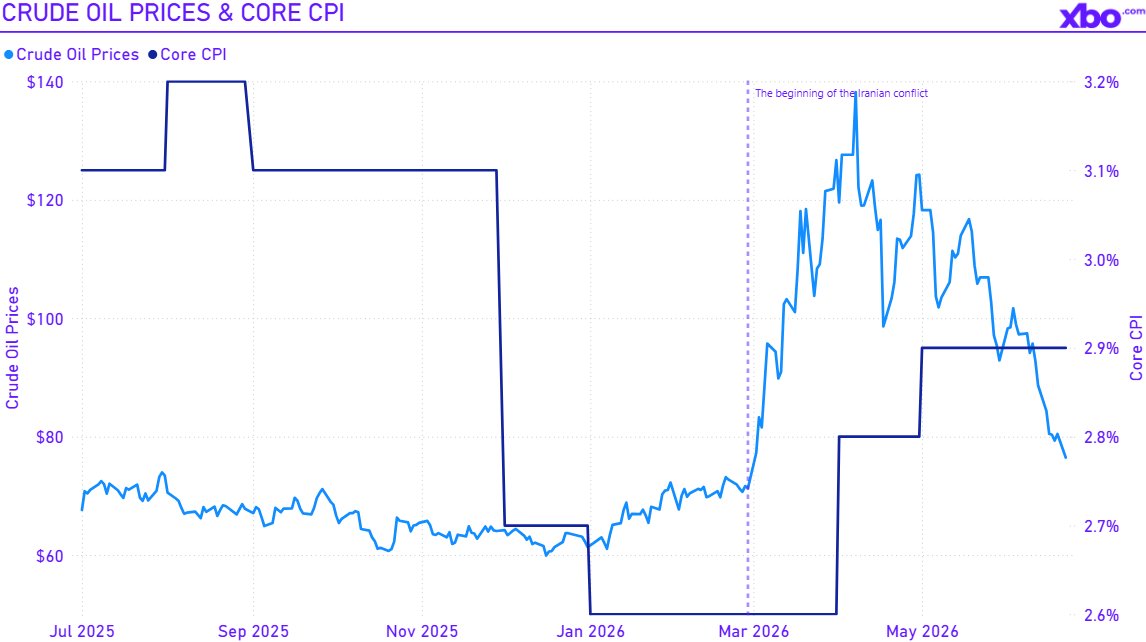
Source: https://fred.stlouisfed.org/
The transmission mechanism was direct. Energy is an input cost across the entire economy, and a supply-driven oil spike feeds directly into both headline and core inflation. The Fed's projected trajectory for Core PCE was revised upward to 3.6% by the end of 2026, well above the 2% target. Because inflation was reaccelerating for reasons monetary policy cannot address, the Fed held its rate in the 3.5–3.75% range, and the market narrative reversed: the question shifted from "when will the Fed cut?" to "will the Fed be forced to hike?" A notable minority of FOMC members were already penciling in at least one hike this year.
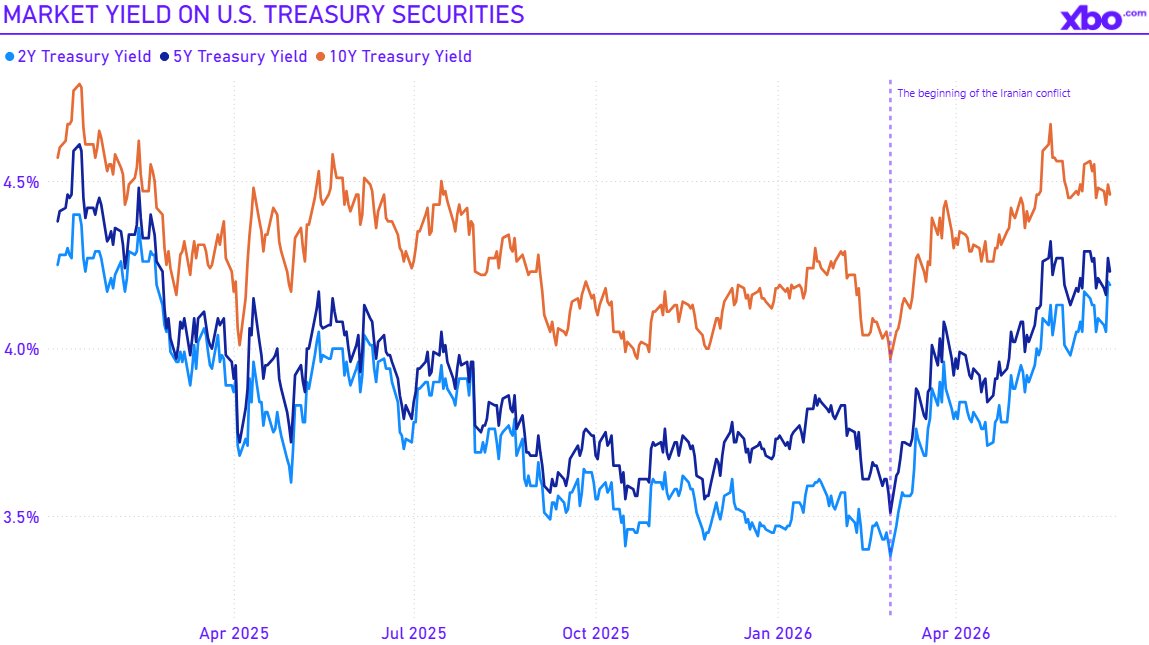
It was precisely this repricing of rate expectations, not a shortage of money, that became the mechanism transmitting the shock to risk assets. Borrowing costs rose across the entire yield curve. In this environment, crypto behaved as a high-beta asset: one that amplifies the moves of the broader market, rising more than others on the way up and falling deeper on the way down.
The liquidity myth of Q2 2026
A common explanation for crypto drawdowns is that "liquidity drained out of the system." This quarter's data does not support that claim, and the distinction is worth addressing directly.
It is important to separate two different things:
- The quantity of money: the volume of reserves in the banking system and the size of the Fed's balance sheet. Governed by quantitative tightening.
- The price of money: interest rates, the cost of credit, the strength of the dollar. Governed by the Fed's policy rate and the market's expectations for its future path.
Measured by quantity, liquidity did not contract in Q2 2026. The Fed's net liquidity, defined as its balance sheet minus the reverse repo facility (RRP) and the Treasury General Account (TGA), remained flat and even drifted higher toward mid-2026. The reason lies in what was happening alongside QT: while the Fed shrank its balance sheet, money market funds were withdrawing the cash they had previously parked at the Fed through the RRP facility. That cash was channeled into short-term government bonds and onward into circulation. This inflow offset the balance-sheet runoff almost dollar for dollar. Moreover, the balance-sheet reduction drew down precisely the RRP funds rather than bank reserves, which are the reserves that support lending and market functioning. As a result, the system's active liquidity barely diminished.
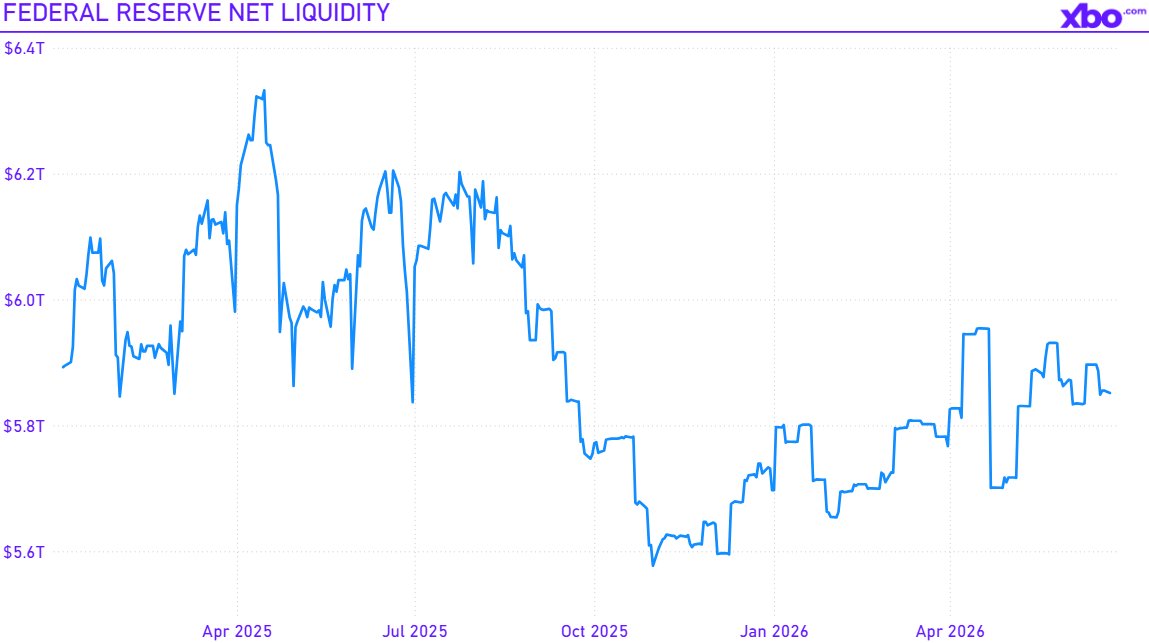
Source: https://fred.stlouisfed.org/
The conclusion follows: the tightening over this quarter was delivered through the price of money, not through its supply. Investors were reacting to capital becoming more expensive, not to its quantity decreasing.
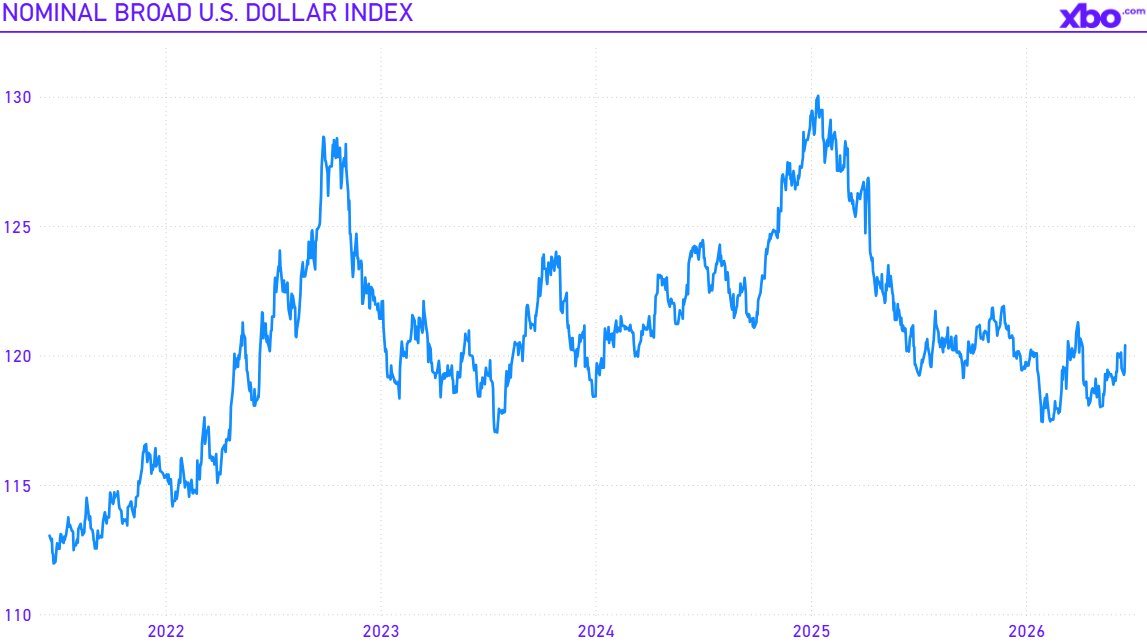
A strong dollar would normally reinforce this tightening by raising the cost of servicing dollar-denominated debt outside the United States. But here, too, the data call for restraint. The broad trade-weighted dollar index held around 119–120 throughout the quarter, well below its January 2025 peak and only slightly above its late-2025 lows. The dollar was firm but not exceptionally strong. It added to the tightening of global conditions but played a secondary role, while the primary driver was the repricing of rate expectations.
Source: https://fred.stlouisfed.org/
The quarter's chain of causation lines up as follows: oil shock, accelerating inflation, a rising cost of money, and investors retreating from risk. The "liquidity drained out of the economy" thesis is not borne out by the data: the Fed's net liquidity did not fall over the quarter, whereas yields rose. In other words, what brought the crypto market down was not a shortage of money but its rising cost, specifically a higher cost of capital against a persistently high policy rate, to which a firm dollar added without defining the picture. This distinction is central to the outlook ahead: for risk assets, an upward reversal will depend first and foremost on a softening of the Fed's rate rhetoric, not on an expansion of its balance sheet.
Bitcoin: On-Chain, ETFs, and Treasuries
Losses are being realized, but the coins are moving to "strong hands"
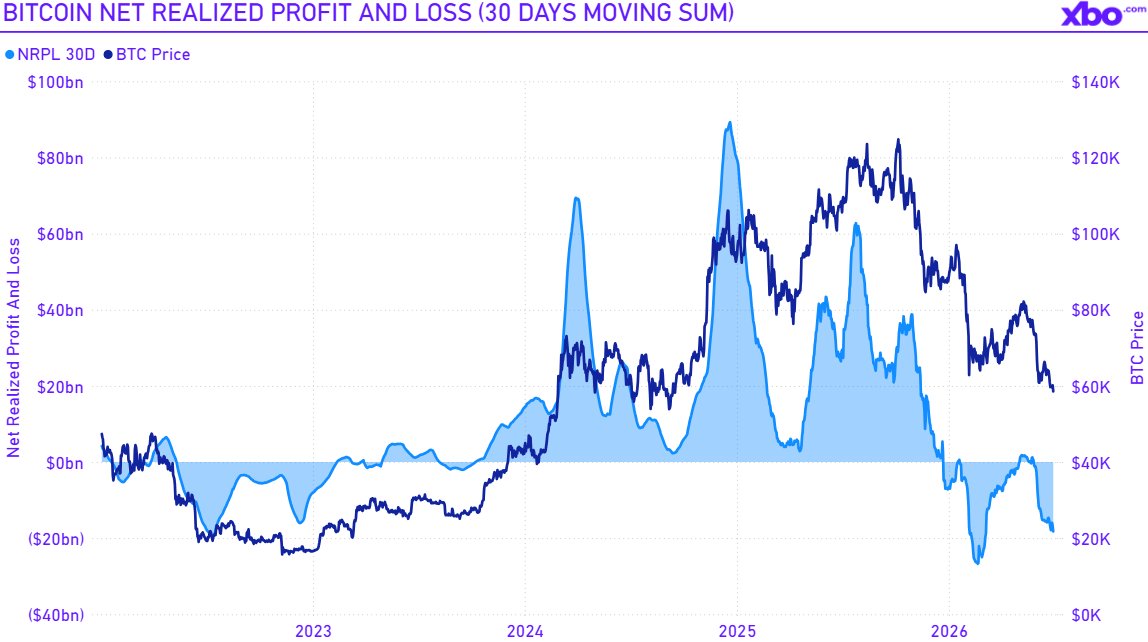
The intra-quarter on-chain picture reflects the same macro fear described above. Bitcoin's net realized profit/loss (NRPL, smoothed as a 30-day moving sum) began rising again from May and exceeded $18 billion by the end of the quarter. Put simply, coins were largely changing hands at prices below their purchase price, which is the signature of selling by those exiting at a loss.
Source: https://charts.bgeometrics.com/nrpl_dark.html
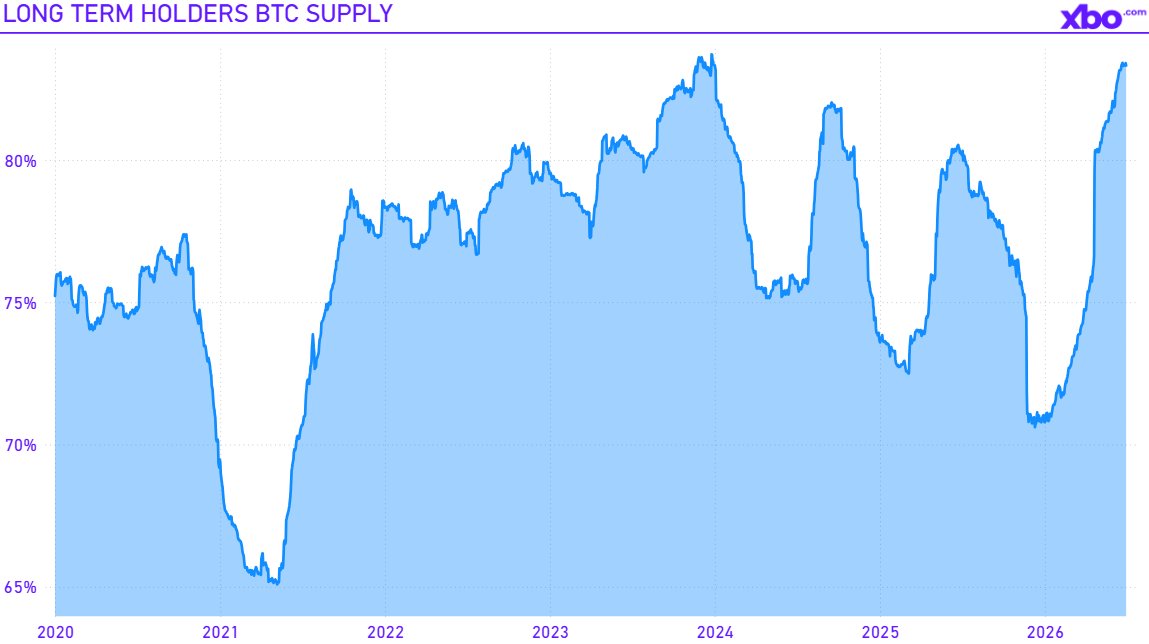
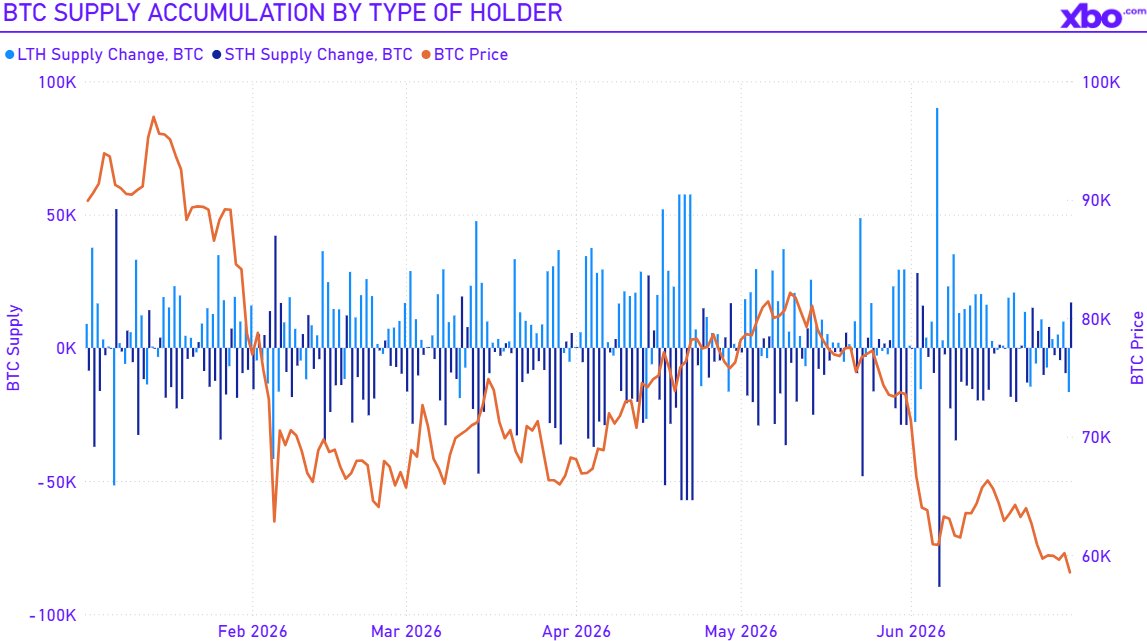
Not everyone was selling, however. Long-term holders (LTHs) not only refrained from cutting their positions but actively added to them: by the end of the quarter, they controlled more than 83% of all Bitcoin supply, nearly matching the all-time high. Since the start of the year, it was LTHs that absorbed the selling from short-term holders (STHs): coins flowed from speculative, price-sensitive hands to those holding for the long term.
Source: https://www.checkonchain.com/
Such LTH behavior is typical and explainable. First, long-term holders historically buy more aggressively precisely on drawdowns, not at peaks. Second, their conduct points to an absence of panic: the likely logic behind such holding rests on a macro scenario in which the conflict in Iran de-escalates, oil supply recovers, and prices fall below pre-conflict levels. That would sharply slow inflation and give the Fed room to at least refrain from hiking this year. For a long-term holder, a drawdown caused by a temporary external shock is an opportunity, not a reason to exit.
Source: https://www.checkonchain.com/
ETFs and funds: The quarter's main seller
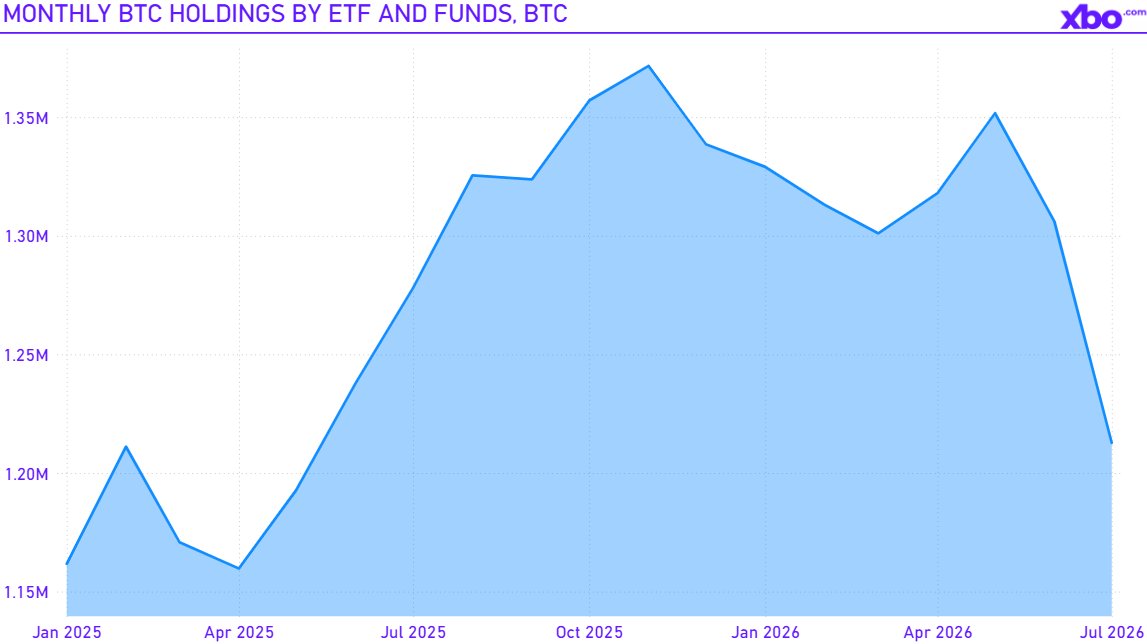
The contrast comes from exchange-traded vehicles. Unlike LTHs, ETFs and funds were net sellers in Q2 2026: their combined holdings fell from 1,318,040 BTC at the start of the quarter to 1,212,705 BTC by its end, which amounts to a drop of 105,335 BTC. The selling was uneven: holdings actually rose through May, with the bulk of the offloading concentrated in June, at the peak of macro stress and rising realized losses.
Source:cryptoquant.com
Treasuries: Public companies accelerate accumulation
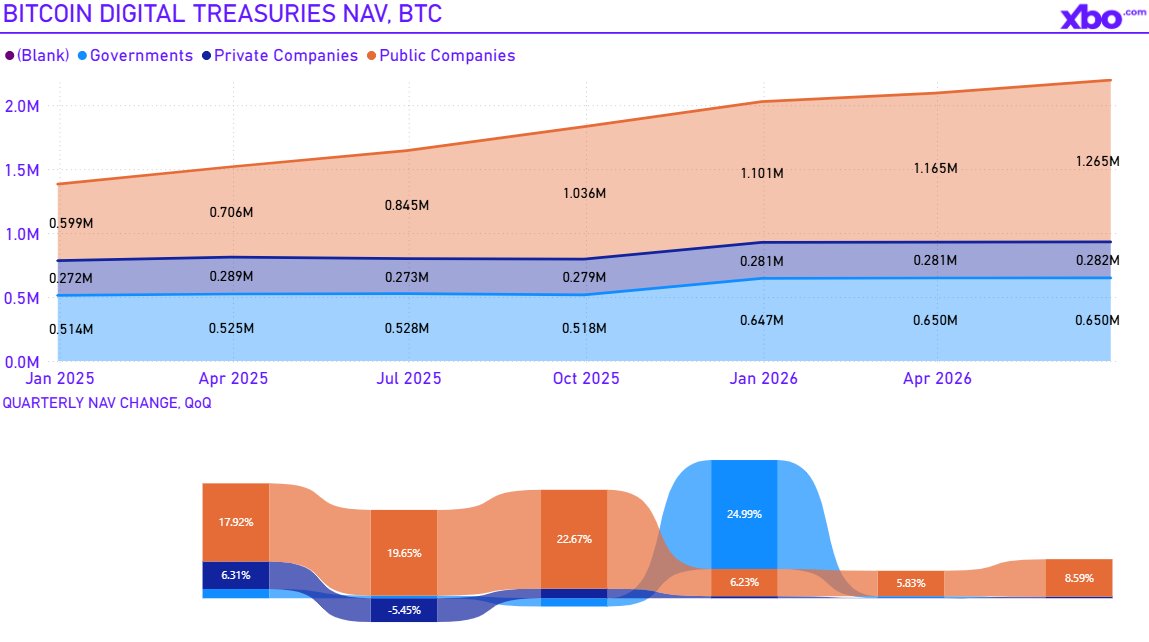
Corporate treasuries moved in the opposite direction from the funds. Public companies increased their holdings by more than 100,000 BTC over the quarter, reaching 1,264,916 BTC, 8.6% more than a quarter earlier. Notably, the pace of accumulation accelerated: the prior quarter's increase was 5.8%.
Private companies added just 1,022 BTC, a +0.4% gain for the quarter, bringing their holdings to 281,752 BTC. Government holdings barely changed, rising by just 91 BTC over the quarter to 649,944 BTC across all countries combined, consistent with a hold policy rather than active operations.
Source: https://bitcointreasuries.net/
Taken together, the flows of Q2 2026 paint a picture of large-scale Bitcoin redistribution, from price-sensitive holders to long-term and strategic ones. The direction of movement was uniform across categories, and the picture is internally consistent.
On the supply side of this redistribution stood two groups. The first was exchange-traded vehicles: ETFs and funds were the quarter's net sellers, cutting their combined holdings by 105,335 BTC, with selling skewed toward the end of the period. Holdings rose through May, but the main offloading came in June, at the peak of macro stress. The second group included short-term holders (those holding coins for less than ~155 days): they capitulated, locking in losses. Their exit is exactly what the quarter's realized loss of over $18 billion reflects.
On the demand side were long-term holders and the corporate sector. Long-term holders absorbed the supply coming from short-term and exchange-based participants throughout the quarter, raising their share above 83% of all circulating Bitcoin, which is near the all-time high. Public companies were the most active category of buyers: they added more than 100,000 BTC and, importantly, accelerated their pace of accumulation compared to 5.8% in the prior quarter. Private companies and governments, meanwhile, remained essentially static, meaning the entire corporate impulse came specifically from public companies.
In sum, over the quarter Bitcoin shifted markedly out of speculative and fund-based hands and into those of long-term holders and public treasuries. Speculative and exchange-based positioning was washed out under pressure from the macro backdrop, while strategic and corporate demand not only persisted but accelerated, concentrating an ever-larger share of supply among the participants least inclined to sell.
Sectors: A Turn Toward Decentralization, Privacy, and Real-World Assets
Quarterly sector performance
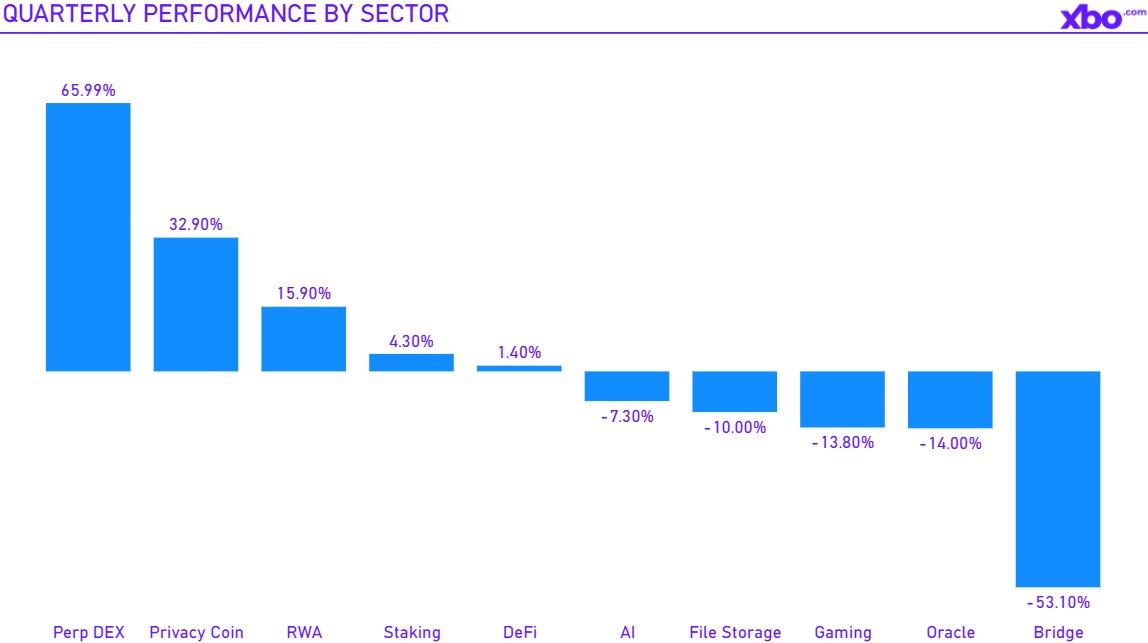
The dispersion of returns across sectors in Q2 2026 was extreme, ranging from +66% to −53%, and its structure is no accident. It reflects the market's broad shift toward decentralization, privacy, and real-world assets. All these themes became especially relevant amid the Iran conflict, when demand for self-custody of capital and for defensive assets rose sharply.
The quarter's leaders line up into a single logic. Perp DEX (+66%) represents decentralized perpetual exchanges, offering trading without an intermediary and with retained control over assets. Privacy Coins (+33%) reflect direct demand for privacy. RWA (+16%) captures real-world assets on the blockchain. Against the backdrop of geopolitical escalation, it was precisely these three themes (self-custody, confidentiality, and "hard" assets) that proved most in demand.
Source: https://classic.artemis.ai/home
Staking (+4.3%) and DeFi (+1.4%) deserve a separate explanation, having posted modest but positive results. Two factors were at work here. First, DeFi protocols and blockchains actively formed partnerships throughout the quarter, expanding integrations and capital inflows. Second, holders who were underwater and unwilling to sell on the drawdown likely directed their assets into yield pools and staking, seeking a way to earn on their holdings rather than lock in a loss.
DeFi would likely have posted stronger growth were it not for a record-scale wave of hacks. Q2 2026 was the worst quarter for DeFi security in the industry's history, with over 80 incidents and more than $750 million stolen. Nearly half of the losses came from bridges, which also explains the Bridge sector's -53% slump. The two largest exploits, both attributed to the North Korean group Lazarus, occurred at the start of the quarter: Drift Protocol ($285 million, April 1) and Kelp DAO ($292 million, April 19, a LayerZero bridge exploit). The Kelp DAO hack also affected Aave: the rsETH token was used as collateral in the protocol, leading Aave to estimate potential bad debt of $124–$230 million, while roughly $71 million was frozen amid the ensuing litigation. In parallel, the sector was weighed down by a separate internal conflict within the Aave ecosystem: a governance dispute between Aave Labs and the Aave DAO over revenue sharing and control, which undermined confidence in one of DeFi's key protocols.
The laggards included Bridge (−53%), Oracle (−14%), Gaming (−14%), and AI (−7%). All are infrastructure and speculative segments most sensitive to risk-off: when risk appetite contracts, capital leaves these first. In Bridge's case, the decline was compounded by the direct blow from bridge hacks, which became the quarter's principal attack vector.
RWA: Quarterly results
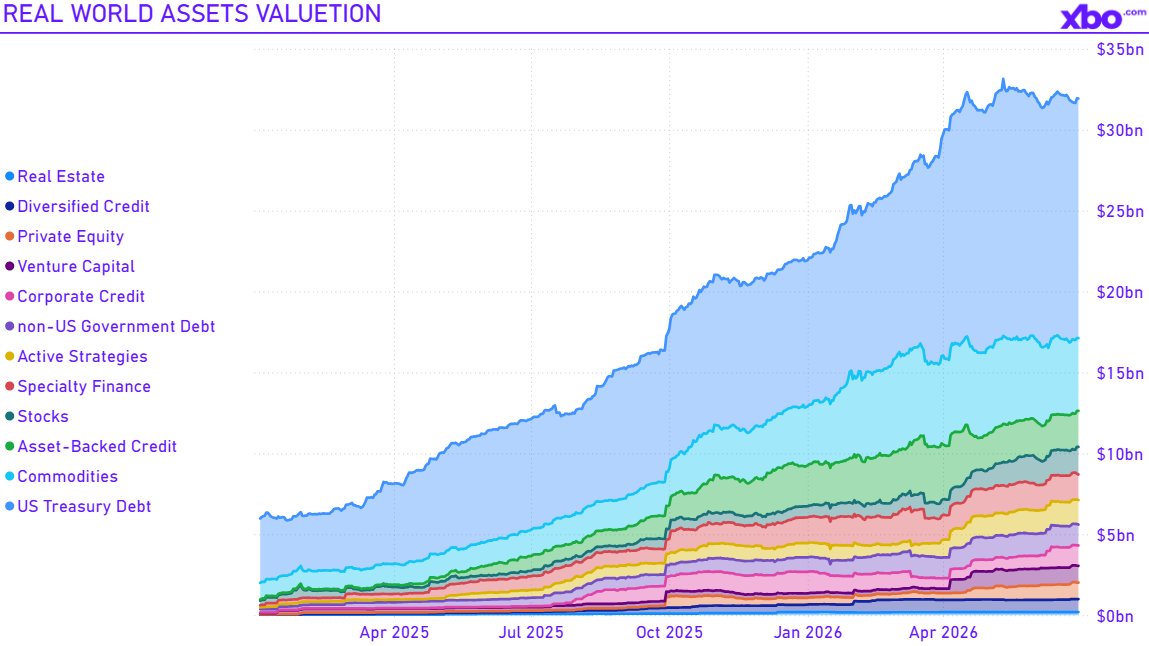
RWA was one of the few sectors with positive dynamics both in token prices (+15.9%, the quarter's third-best result) and in on-chain asset value. By the end of Q2 2026, the total value of tokenized real-world assets reached $31.9 billion, 5.4 times more than at the start of 2025, confirming RWA as one of the market's principal structural narratives.
Source: https://app.rwa.xyz/
The data, however, call for an important caveat. Over the second quarter itself, RWA volume grew by only 7.5%, which represents a marked slowdown after the parabolic growth of prior quarters. In other words, for RWA, Q2 2026 was a quarter of consolidation rather than expansion: amid macro stress, the sector held onto its gains, but the pace of new asset issuance dropped sharply.
The sector's structure explains its resilience. Its foundation ($14.8 billion or roughly 46% of total RWA value) is tokenized US government debt, and it was precisely this category that remained the growth anchor for the quarter (+8.4% in Q2). In essence, this is demand for "safe yield on the blockchain": tokenized Treasury bills function as an interest-bearing on-chain equivalent of cash, and amid geopolitical instability that demand is naturally resilient. By contrast, the second-largest category within RWA, commodities ($4.5 billion, or ~14% of total RWA value, predominantly gold-backed assets), contracted by 18% over the quarter.
At the same time, the sector was broadening beyond government debt: tokenized private markets grew notably, including venture capital, private equity, equities, and corporate credit (multiple-fold growth, albeit from a low base). This is a sign of RWA's gradual maturation: from an almost single-minded bet on tokenized Treasuries toward a more diversified structure that also encompasses private assets.
The overall takeaway for the sector is as follows: RWA confirmed its status as a structural leader and a defensive theme of a bearish quarter, but in Q2 2026 it shifted from a phase of explosive growth into one of consolidation, retaining the dominance of tokenized US government debt while gradually diversifying into private markets.
Stablecoins: No fresh liquidity is being added
Stablecoin issuance is the most direct indicator of fresh fiat capital flowing into the crypto ecosystem. When a new stablecoin is minted, a dollar ready to buy a crypto asset enters the system; when a stablecoin is redeemed, a dollar leaves it. Net issuance (minting less redemptions) is therefore, in effect, the market's "dry powder": a pool of capital capable of converting into demand for Bitcoin and altcoins.
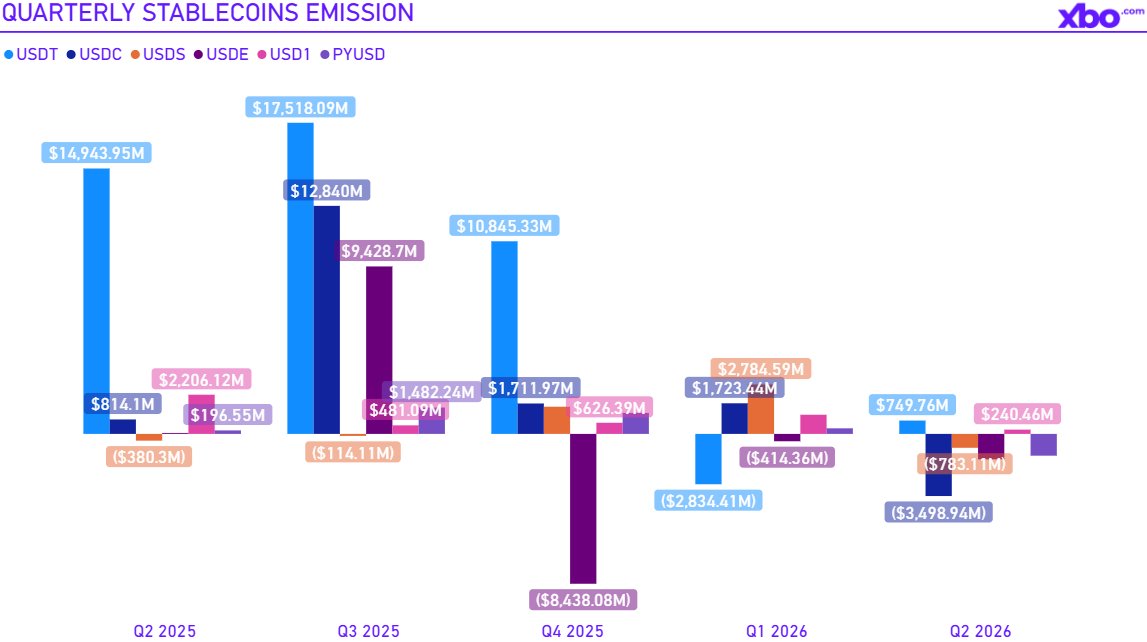
In Q2 2026, this indicator flashed a warning. After a peak inflow of +$41.6 billion in the third quarter of 2025, net issuance slowed for four consecutive quarters and, in the second quarter of 2026, turned negative for the first time, at approximately −$6.0 billion. In other words, stablecoins were not merely being minted less actively; they were being net-redeemed, and the aggregate pool of on-chain dollars shrank.
Source: https://app.rwa.xyz/
The contraction was broad-based. Of the six largest stablecoins, only two posted net growth over the quarter (USDT and USD1), and even that was rather nominal. The rest contracted, with redemptions led by the "institutional" USDC, which lost $3.5 billion over the quarter. PYUSD (−$1.2 billion), USDE (−$1.4 billion), and USDS (−$0.8 billion) also shrank noticeably. The sector's total market capitalization remains high at around $277 billion across the six largest issuers, but its quarterly trajectory turned from growth to decline.
Stablecoin dynamics serve as a crypto-native reflection of what the macro data show. In the macro section, the quantity of Fed liquidity was not growing; here, on-chain liquidity not only stopped growing but began to contract. Both indicators point to the same conclusion: no additional fuel for growth is being added.
From this follow data-based expectations for the second half of the year. Even if the external backdrop turns in favor of risk (whether through de-escalation of the conflict in Iran, cheaper oil, slowing inflation, or a softening of the Fed's rhetoric) sustained market growth will require an inflow of new capital. Meanwhile, the stablecoin pool from which that capital comes is currently shrinking.
On that basis, experts expect that in the event of a reversal, the market will find it harder to rise: a sentiment-driven bounce is possible, but a full and durable uptrend requires the stablecoin base to begin expanding again. Net stablecoin issuance is therefore worth tracking as a leading indicator of any recovery: as long as it remains negative, growth will stay fragile and thinly backed by liquidity.
Conclusion
The second quarter of 2026 presents a single, internally consistent picture. The root cause of the drawdown was external: the oil crisis triggered by the conflict with Iran accelerated inflation, repriced the Fed's rate path, raised the cost of capital, and pushed investors out of risk assets. The quarter's key conclusion is that the market was brought down not by a shortage of money but by its rising cost: the level of liquidity in the global system remained stable, it was the price of money that tightened. That distinction also changes what to watch going forward.
Under the pressure of this macro backdrop, a fundamentally healthy redistribution was underway within crypto. Bitcoin and market supply flowed from speculative and exchange-based participants to long-term holders and public treasuries, while capital within sectors shifted toward structural themes such as decentralization, privacy, and real-world assets. RWA confirmed its status as a defensive narrative, even as it moved into a consolidation phase. In other words, weak hands were washed out, while strategic demand not only persisted but, in some cases, accelerated.
At the same time, the data highlight a key obstacle to any recovery: shrinking crypto-native liquidity. Net stablecoin issuance, the most direct measure of this liquidity, turned negative for the first time in a long while. The pool of capital that can convert into demand is shrinking, itself a consequence of costlier global money and risk-off sentiment. On that basis, expectations for the second half of the year are as follows: even with a turn in the external backdrop, whether through de-escalation of the conflict, cheaper oil, slowing inflation, or a softening of the Fed's rhetoric, sustained growth will require an inflow of new capital and therefore a renewed expansion of the stablecoin base.
Looking ahead, two indicators will signal whether a genuine reversal is underway: a softening of the Fed's stance on rates, most likely triggered by the resolution of the Iran conflict, and a return of net stablecoin issuance to growth. Until both conditions are met, any market recovery is likely to remain fragile.
Disclaimer: This article is for informational purposes only and not financial advice. XBO makes no guarantees about the data's accuracy. Readers should consult an advisor before making decisions and are responsible for their actions.