Why On-Chain Transaction Is the Key Blockchain Indicator

On-chain transaction volume is the pulse of blockchain networks. For digital asset investors, monitoring these flows within the network and comparing them across protocols is a way to ascertain adoption rates and utility of the protocol, and determine whether a project is further developing, or an obsolete relic of the previous market cycle.
This perspective gives us valuable insights into user activity, network utility, and the overall health of the crypto ecosystem. A surge in transaction volume often signifies increased network usage, adoption and trading activity. It could indicate growing interest, new protocol utility, or even speculative fervor. Conversely, a decline in on-chain transaction volumes might signal reduced network development, protocol stagnation or loss in market share to other competitors.
You’re reading Crypto Long & Short, our weekly newsletter featuring insights, news and analysis for the professional investor. Sign up here to get it in your inbox every Wednesday.
Several factors drive blockchain trading volume, and understanding these nuances helps us navigate the ever-evolving crypto market cycle. During bullish phases, when the crypto market resembles a bullish festival of excess, trading volumes tend to surge. Positive news, like regulatory clarity, institutional adoption or significant protocol upgrades, can spark heightened trading activity.
Additionally, market sentiment plays a crucial role. Bullish sentiment often drives traders and investors to flock to decentralized exchanges, causing a surge in transactions on-chain. There, they tend to be more focused on trading newer innovative products such as NFTs and smaller token launches, which have a greater impact on on-chain activity than major tokens traded within centralized exchanges. This contributes to increased trading volumes during bullish cycles.
Conversely, during bearish periods, trading volumes start to dwindle, with bursts of activity around periods of deleveraging. Uncertainty, negative news, regulatory crackdowns, or market corrections often lead to a decline in trading. Investors might adopt a wait-and-see approach, leading to decreased transaction volumes, and they might move their assets to cold storage or stablecoins, reducing the overall trading activity on exchanges.
To better dig into the usefulness of on-chain transaction volume data, we use data provided by SonarVerse, which provides OnChain Trading Dollar Volume by protocol, and compare volume across Bitcoin, Ethereum and Polygon protocols.
To normalize the volume across these protocols, we divide the transaction volume by market capitalization of the protocol. (see Figure 1 below)
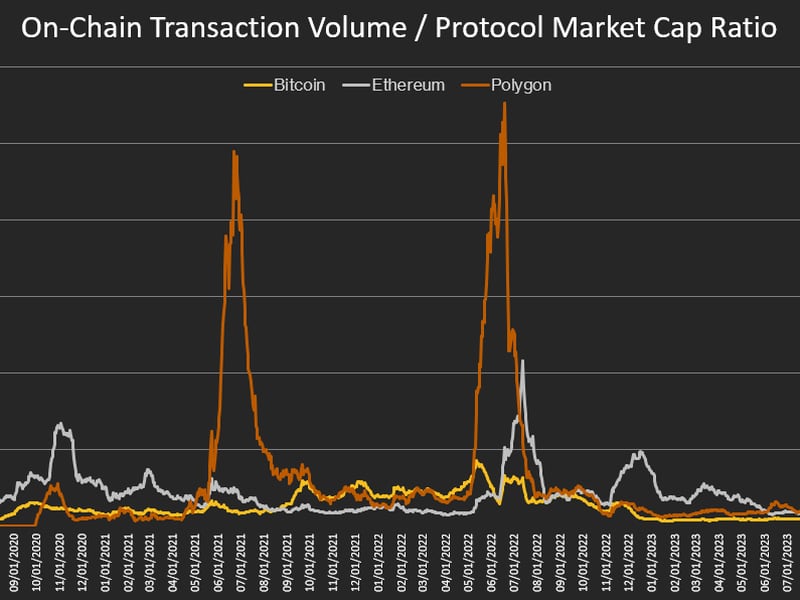
Figure 1: On-Chain Trading Volume / Market Capitalization, by protocol, 30d smoothed, Source: SonarVerse, CoinDesk Indices Research
Here, we can see the relatively low and steady transaction volume of bitcoin, with Ethereum and Polygon having peaky and relatively offsetting activity, which makes sense given that Polygon is an EVM scaling solution for Ethereum based protocols.
To further highlight the investment benefits of this data, we run a very simple backtest, where we rotate across Ethereum and Polygon protocols based on recent normalized on-chain volume activity with the simple rule that when normalized Polygon trading activity is greater than Ethereum we rotate into Polygon, otherwise we hold Ether token (see Figure 2 below for hypothetical backtest strategy).
The rotation strategy improves absolute and risk-adjusted returns over a crypto market cycle when compared to separate allocations to Ether and Polygon tokens. This outperformance could be due to the information contained within the on-chain trading volume metric, which tilts the hypothetical strategy towards protocols with greater recent activity, and by association, greater blockchain protocol demand.
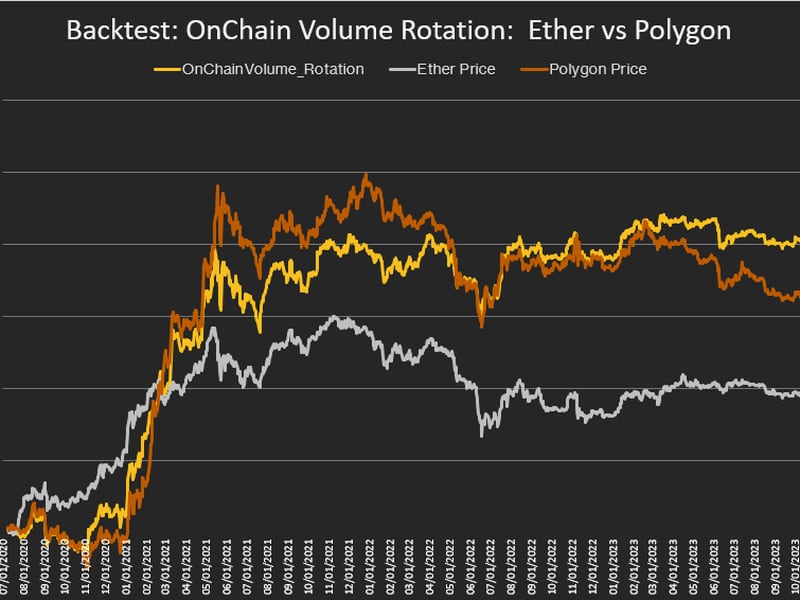
Figure 2: Ether / Polygon Rotation Strategy, Long-Only. Source: SonarVerse, CoinDesk Indices Research
By understanding the dynamics of on-chain activity, we can better gauge market sentiment, and make more informed trading decisions by assessing underlying protocol health. During bullish phases, high trading volumes can signal potential profit-taking opportunities or heightened volatility. In bearish cycles, low volumes might indicate potential market bottoms or opportunities for accumulation.
Keeping an eye on on-chain transaction volumes and other blockchain metrics like TVL is like listening to the heartbeat of the crypto market, allowing investors to navigate its twists and turns caused by industry developments.
Related news

Bitcoin Chops Around $64K, With Japanese Yen's Tumble Maybe Signaling 'Currency Turmoil,' Analyst Says

NEAR and SHIB Led CoinDesk 20 Gainers Last Week: CoinDesk Indices Market Update

First Mover Americas: Bitcoin Holds Stable as ETF Outflows Increase

ARK Sells Last of Its ProShares Bitcoin Futures ETF Shares

Bitcoin Stable Above $64K While ETF Outflows Hit $200M


