Market Wrap: Bitcoin's Price Retreats Along With Stocks

Price Action
Bitcoin (BTC) and ether (ETH) both fell on Tuesday.
- Bitcoin declined, a reversal from the previous day. The largest cryptocurrency by market cap was down 1.8% on the day, falling 0.4% during the 13:00 UTC hour on higher-than-average volume.
- Ether, the second-largest cryptocurrency by market cap, was down 1% on Tuesday, also on higher-than-average volume when measured against its 20-day moving average.
This article originally appeared in Market Wrap, CoinDesk’s daily newsletter diving into what happened in today's crypto markets. Subscribe to get it in your inbox every day.
Global Macro: Germany’s harmonized inflation rate was 8.8% for August, versus analysts' estimates of 9%. The harmonized rate allows for the comparison of inflation rates across countries in the European Union.
Although it came in below estimates, the rate is a 50-year high for Germany, increasing the possibility of more rate hikes to stave off inflation. A look at the hourly charts for both BTC and ETH show a sharp decline during the 12:00 UTC hour coinciding with the data release.
In the U.S., job openings for July were 11.24 million, versus estimates of 10.5 million. The news reflects continued tightness in labor markets, which is historically a catalyst for higher inflation.
Expectations for higher inflation increase the probability for continued rate hikes that generally lead to declines in the prices of risky assets, including cryptocurrencies.
Altcoins recently fell, as well, with polkadot (DOT) and uniswap (UNI) both down 3.2%, while AAVE was down 2.2%.
U.S. Equities: The S&P 500, Dow Jones Industrial Average and the tech-heavy Nasdaq Composite were down 1.1%, 0.92% and 1.1% respectively. The three indexes each opened in negative territory and continued to trade lower throughout the day.
Commodities: Crude oil and natural gas were down 5.2% and 2.8% on Tuesday. The price of gold, a traditional safe-haven asset, declined 0.8%, while copper futures fell 1.6%.
Latest Prices
●Bitcoin (BTC): $19,961 −0.8%
●Ether (ETH): $1,545 +0.8%
●S&P 500 daily close: 3,988.85 −1.0%
●Gold: $1,735 per troy ounce −0.1%
●Ten-year Treasury yield daily close: 3.11% +0
Bitcoin, ether and gold prices are taken at approximately 4pm New York time. Bitcoin is the CoinDesk Bitcoin Price Index (XBX); Ether is the CoinDesk Ether Price Index (ETX); Gold is the COMEX spot price. Information about CoinDesk Indices can be found at coindesk.com/indices.
Technical Take
BTC moves into potentially oversold territory
Bitcoin resumed a downward trend after the pause described in Monday’s Market Wrap. The cryptocurrency continues to trade in tandem with other risky assets.
The correlations between BTC, the S&P 500, DJIA and Nasdaq Composite are 0.68, 0.58, and 0.83 respectively, highlighting the strong relationship between BTC and the indexes. Correlations range between 1 and -1, with 1 indicating a direct relationship and -1 implying an inverse relationship.
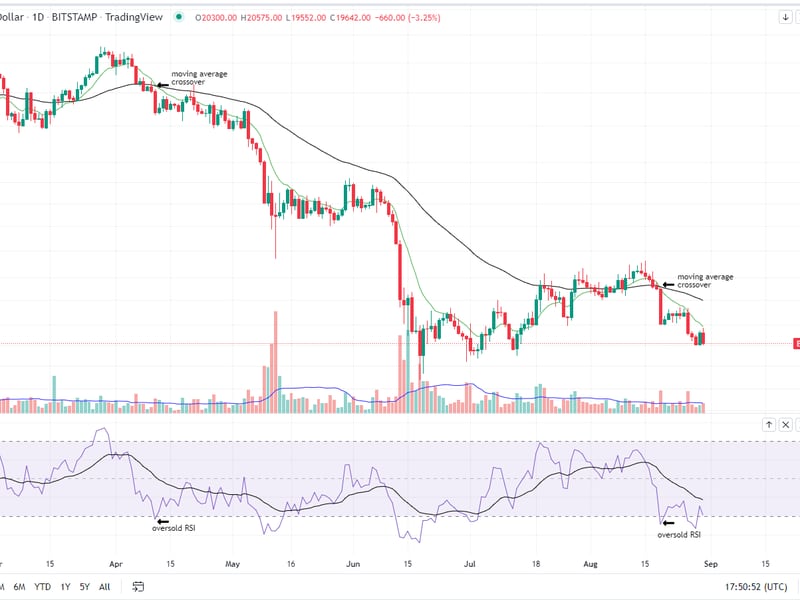
BTC’s price has moved into oversold territory as its relative strength index (RSI) has fallen to 30. The RSI indicator measures an asset’s price momentum. Values above 70 imply that an asset is overbought, while values below 30 imply that an asset is oversold (i.e. undervalued).
BTC’s 10-day exponential moving average (EMA) remains below its 50-day EMA, following a moving average crossover on Aug. 19. Moving average crossovers occur when the shorter period moving average crosses the longer period moving average and imply the potential end of a trend.
The previous 10-day and 50-day EMA negative crossovers occurred on April 11, Nov. 25, 2021, Sept. 21, 2021, May 12, 2021 and April 23, 2021. The corresponding RSI’s were 28, 46, 28.9, 34 and 27.8.
In four of those five occurrences, the change in BTC trend from positive to negative came when BTC had either breached or was approaching oversold levels. The price performance 30 days after each instance, however, was -27%, 53%, -28% and -32% respectively.
Even though the RSI indicates that BTC is oversold, prices going back to 2021 have adhered more to the change in trend to the downside than they have to the indicator itself. BTC prices are 6% below where they stood during the Aug. 19 crossover.
Altcoin roundup
- BNB Chain Introduces Liquid Staking to Provide Crypto Users Access to More Income Streams: Helio Money and Wombat Exchange also joined the liquid staking network. Liquid staking becomes more popular as the Ethereum blockchain proceeds toward becoming a proof-of-stake (PoS) system. Read more here.
- Crypto Custody Technology Firm Fireblocks Adds Support for Solana Blockchain’s DeFi, NFT, Gaming Apps: The integration also pushes support for the WalletConnect2 protocol across the Solana ecosystem, said Fireblocks CEO Michael Shaulov. The firm previously provided support for Solana’s native token SOL as well as for stablecoins such as USDC on the network. Read more here.
- Crypto Lender Nexo Allocates Additional $50M for Token Buyback Initiative: After purchasing its native tokens NEXO, the Switzerland-based lender will hold them in a vesting period for 12 months. Read more here.
Relevant insight
- Listen 🎧: Today’s "CoinDesk Markets Daily" podcast discusses the latest market movements and a look at companies embracing meme stocks as a way to survive.
- Solana-Based Automation Network Clockwork Raises $4M in Seed Funding: The decentralized network uses the Solana validator to facilitate tasks such as automated payments.
- Brazilian Crypto Exchange Digitra.com Launches Trading Platform Using Nasdaq's Cloud-Based Technology: Nasdaq’s Marketplace Services Platform will support Digitra’s new "trade-to-earn" feature that awards tokens for every executed trade.
- Stablecoin Issuer Tether Dismisses Wall Street Journal's Claim of Inadequate Reserves: The newspaper reported that the firm's assets outweigh its liabilities by just $191 million, implying a relatively "thin cushion of equity."
- Temasek to Lead $100M Funding Round in NFT and Metaverse Investor Animoca Brands, Bloomberg Reports: The sovereign wealth fund, whose net portfolio value stood at $403 billion in March, has been an active investor in the crypto industry.
- South Korea Must Reverse Ineffective Ban on Crypto ICOs, Central Bank Says: The Bank of Korea says companies like stablecoin issuer Terra were able to circumvent the ban and sell digital tokens to locals by setting up corporations overseas.
Other markets
Biggest Gainers
| Asset | Ticker | Returns | DACS Sector |
|---|---|---|---|
| Cosmos | ATOM | +5.5% | Smart Contract Platform |
| Avalanche | AVAX | +3.1% | Smart Contract Platform |
| Cardano | ADA | +0.9% | Smart Contract Platform |
Biggest Losers
| Asset | Ticker | Returns | DACS Sector |
|---|---|---|---|
| Dogecoin | DOGE | −2.4% | Currency |
| Polkadot | DOT | −2.0% | Smart Contract Platform |
| Stellar | XLM | −1.9% | Smart Contract Platform |
Sector classifications are provided via the Digital Asset Classification Standard (DACS), developed by CoinDesk Indices to provide a reliable, comprehensive and standardized classification system for digital assets. The CoinDesk 20 is a ranking of the largest digital assets by volume on trusted exchanges.
Related news

Bitcoin to Account for 7% of Global Wealth, Surge in Price to $13M in 21 Years: Michael Saylor

CoinDesk 20 Performance Update: RNDR's 12% Gain Leads as Index Rebounds

First Mover Americas: Bitcoin Regains $67,000, Adds Nearly 5% in 24 Hours

Elon Musk’s X Quietly Removes Bitcoin, MAGA Emojis From Hashtags

Bitcoin Analysts Express Optimism as Price Nears Resistance Level That Stymied It in May


