Market Wrap: Bitcoin Remains in a Quiet Place Ahead of FOMC Minutes

Price Action
Bitcoin and ether traded flat on Tuesday, continuing a theme of low volume and volatility in digital asset markets in recent weeks.
Bitcoin (BTC) trading volume fell below its 20-day moving average for the seventh consecutive day, and 10th of the last 11. Bitcoin’s price continued its recent decline, falling 0.45% over the past 24 hours. The drop was the sixth negative day out of the last seven. The average true range of BTC price movement has fallen 22% so far in October, an indication of decreasing volatility.
Ether (ETH) trading volume fell below its 20-day moving average for the 11th consecutive day. The price fell 0.66% and now sits below the psychologically important $1,300 mark. Echoing BTC, ETH’s price has stagnated in recent weeks and been largely range-bound since Sept 21.
In broader crypto markets, the CoinDesk Market Index (CMI), a broad-based market index that measures the performance of a basket of cryptocurrencies, fell 0.90%. The top gainer on Tuesday was terraUSD, up 34% to 5 cents, while the top declining asset was quantstamp(QSP), down 22%. BinanceUSD (BUSD) was the top traded crypto asset on Tuesday.
Macro View
Traditional financial markets were mixed, with the Dow Jones Industrial Average (DJIA) increasing 0.12%, while the tech-heavy Nasdaq Composite and S&P 500 fell 1.10%, and 0.65%, respectively.
Breadth measures in traditional finance imply continued selling pressure because 71% of stocks trading on the NYSE, Nasdaq and NYSE American (formerly AMEX) exchanges declined compared with 22% that traded higher. Market breadth measures the number of assets trading higher compared to the number of assets trading lower.
In commodities, crude oil traded lower as West Texas Intermediate oil declined 1.7% to fall below $90 per barrel. European Brent crude declined 1.6% to $94.61 per barrel. In metals, copper futures, often used as an indication of economic growth fell 0.03%. Traditional safe haven gold rose 0.14%.
Latest Prices
● CoinDesk Market Index (CMI): 936.32 −1.7%
● Bitcoin (BTC): $19,042 −1.0%
● Ether (ETH): $1,285 −1.7%
● S&P 500 daily close: 3,588.84 −0.7%
● Gold: $1,673 per troy ounce +0.4%
● Ten-year Treasury yield daily close: 3.94% +0.05
Bitcoin, ether and gold prices are taken at approximately 4pm New York time. Bitcoin is the CoinDesk Bitcoin Price Index (XBX); Ether is the CoinDesk Ether Price Index (ETX); Gold is the COMEX spot price. Information about CoinDesk Indices can be found at coindesk.com/indices.
Technical Take
Another Quiet Trading Day for Bitcoin
Bitcoin traded flat again Tuesday as macroeconomic themes continued to weigh heavily on investors who are now waiting for the release of the minutes of the last Federal Open Market Committee (FOMC) meeting on Wednesday, and the latest Consumer Price Index (CPI) inflation data on Thursday. Trading volume has been tepid.
Economic observers widely believe the CPI will tick slightly downward to 8.1% annually, although month over month they expect a 0.1% price increase. The FOMC’s next rate decision should reflect the Fed’s priority in taming inflation.
BTC continues to behave as though it’s a “mean reversion” trade, as prices toggle above and below its 20-day moving average before reversing course back to its mean.
Appearing more clearly on its hourly than daily chart, BTC’s price has tended to show above-average volume during hours when the price breaches the upper range of its Bollinger Bands before reversing course.
To the extent traders can execute a nimble mean reversion trading strategy, they are likely to find opportunity in this market. Traders looking to find a trending asset class won’t find as much, given current price behavior. Investors looking to establish a longer-term position while minimizing their cost basis may find positive news on-chain, but not without cause for concern.
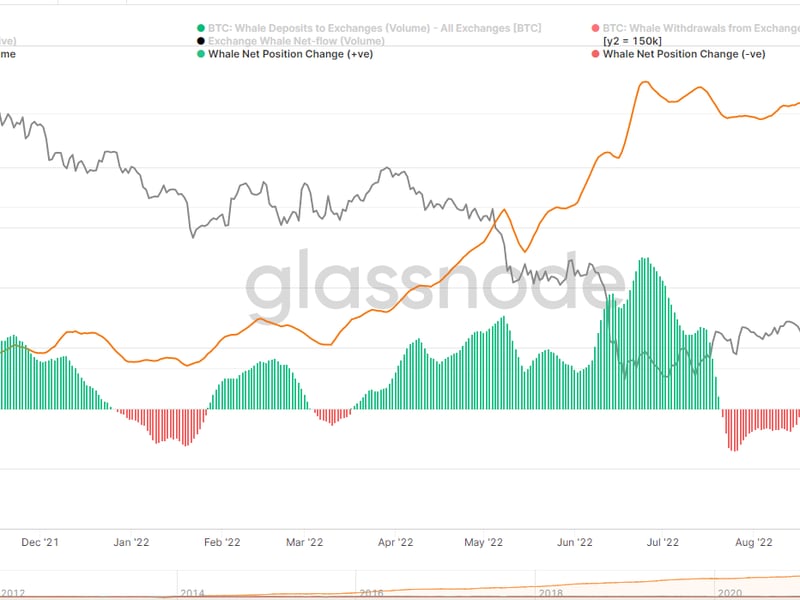
Glassnode data shows that “whale” net volume to and from exchanges has been declining since Sept 16. Whales are investors holding at least 1,000 BTC.
Movement of coins off centralized exchanges is price supportive because those coins are likely being moved into cold storage. Movement of BTC to exchanges implies that coins are intended to be sold.
Glassnode data also indicates that the cost basis for whales since 2017 is approximately $15,800. BTC’s price has decreased 5% since Sept. 16. With the price now within 25% of the cost basis for large BTC holders, they have been moving BTC off exchanges.
While not necessarily a bullish catalyst, this trend provides insight into where sentiment lies for BTC holders with the most aggregate exposure.
A note of caution, however, can be gleaned from derivatives markets. Specifically, there has been an uptick in the open interest for puts at the $19,000 strike price. Additionally, the put/call ratio for BTC has increased, indicating that traders are purchasing additional downside protection.
Altcoin Roundup
- Former CEO of Bankrupt Crypto Lender Celsius Cashes Out $960K in CEL, USDC, Data Shows: Alex Mashinsky, who resigned as Celsius’ CEO on Sept. 27, continued to move crypto out of wallets while withdrawals are suspended for customers. Read more here.
- SEC Probing Bored Ape Creator Yuga Labs Over Unregistered Offerings, Bloomberg Reports: The key legal question at the center of the probe, according to Bloomberg, is whether non-fungible tokens (NFT) are securities. Read more here.
Trending posts
- Listen 🎧: Today’s "CoinDesk Markets Daily" podcast discusses the latest market movements and a look at how some corporations are bringing crypto to the mainstream.
- Google Partners With Coinbase to Accept Crypto Payments for Cloud Services: The tech giant will also use Coinbase's custody service, Coinbase Prime.
- Bitcoin Options Traders, Burned by Last Month’s CPI Report, Now Seek Downside Protection: Investors seem worried the impending inflation report may inject renewed downside volatility in bitcoin and are preparing for the same.
- Crypto Exchange Bittrex to Pay $30M in US Treasury Sanctions Settlement: Crypto exchange Bittrex will pay the U.S. Treasury Department’s sanctions and money laundering watchdogs $30 million to settle allegations it maintained a poor compliance program between 2014 and 2017.
- WisdomTree’s Spot Bitcoin ETF Rejected by the SEC: It's the latest in a string of spot bitcoin ETF denials by the federal regulator.
CoinDesk Market Index
Biggest Gainers
| Asset | Ticker | Returns | DACS Sector |
|---|---|---|---|
| dYdX | DYDX | +9.15% | DeFi |
| Hedera | HBAR | +4.82% | Smart Contract Platform |
| Chain | XCN | +4.47% | Currency |
Biggest Losers
| Asset | Ticker | Returns | DACS Sector |
|---|---|---|---|
| Celsius | CEL | -20.03% | Currency |
| ApeCoin | APE | -10.69% | Culture & Entertainment |
| LCX | LCX | -9.2% | Currency |
Sector classifications are provided via the Digital Asset Classification Standard (DACS), developed by CoinDesk Indices to provide a reliable, comprehensive and standardized classification system for digital assets. The CoinDesk Market Index (CMI) is a broad-based index designed to measure the market capitalization weighted performance of the digital asset market subject to minimum trading and exchange eligibility requirements.
Related news

Bitcoin to Account for 7% of Global Wealth, Surge in Price to $13M in 21 Years: Michael Saylor

CoinDesk 20 Performance Update: RNDR's 12% Gain Leads as Index Rebounds

First Mover Americas: Bitcoin Regains $67,000, Adds Nearly 5% in 24 Hours

Elon Musk’s X Quietly Removes Bitcoin, MAGA Emojis From Hashtags

Bitcoin Analysts Express Optimism as Price Nears Resistance Level That Stymied It in May


