Market Wrap: Bitcoin and Ether Start the Week Higher

Price Action
Bitcoin and ether started the week in positive territory as risk assets of various stripes rose. Macroeconomic data will be relatively light this week, although markets will be eyeing Wednesday’s inflation data from Great Britain along with U.S. housing starts on the same day.
- Bitcoin (BTC) rose 1.4% on Monday on moderate volume as the price at one point reached as high as $19,670. BTC began a steady ascent early Monday, rising for five consecutive hours before retracing.
- Ether’s (ETH) price increased 1.3% as the second-largest cryptocurrency by market capitalization continued to hover above $1,300. ETH pushed higher during the 13:00 UTC (9:00 a.m. ET) hour before declining, and reached as high as 1,337. ETH is up approximately 0.01% since Oct. 8, when the asset became deflationary for the first time since the Sept. 15 Ethereum Merge upgrade from proof-of-work to proof-of-stake.
- The CoinDesk Market Index (CMI), a broad-based market index that measures the performance of a basket of cryptocurrencies, is up 1.33%.
- The top altcoin gainers recently were Polymath Network’s POLY and Injective Protocol’s INJ, which rose 27% and 13%, respectively. The laggards on the day were Index Chain’s IDX and XYO Network’s XYO.
Macro View
The overriding narrative in crypto continues to be its connection with macroeconomic news, particularly on inflation and economic growth. The Oct. 27 release of GDP data will show whether the U.S. economy remains in a recession.
The CME FedWatch tool data shows the possibility of a 50 basis point interest rate hike, although the probability remains low at just 4.6%. The larger takeaway is that a 100 basis point hike no longer seems to be a possibility. Markets are currently assigning a 95% probability the U.S. Federal Reserve’s Federal Open Market Committee will increase rates by 75 basis points in November.
Traditional financial markets were higher, with the Dow Jones Industrial Average (DJIA), tech-heavy Nasdaq and S&P 500 rose 1.8%, 3.5% and 2.7%, respectively.
In commodities, energy markets were mixed. West Texas Intermediate crude and European Brent crude were up 0.57% and 0.61%, while natural gas declined 7.2%. In metals, safe-haven gold rose 1.3% while copper futures increased 0.26%.
Latest Prices
● CoinDesk Market Index (CMI): 952.78 +1.0%
● Bitcoin (BTC): $19,519 +1.0%
● Ether (ETH): $1,325 +1.1%
● S&P 500 daily close: 3,677.95 +2.6%
● Gold: $1,654 per troy ounce +0.7%
● Ten-year Treasury yield daily close: 4.01% +0.005
Bitcoin, ether and gold prices are taken at approximately 4pm New York time. Bitcoin is the CoinDesk Bitcoin Price Index (XBX); Ether is the CoinDesk Ether Price Index (ETX); Gold is the COMEX spot price. Information about CoinDesk Indices can be found at coindesk.com/indices.
Technical Take
BTC trades near 20-day short-term average, maintains inverse relationship to US dollar
Bitcoin traded higher on Monday but stalled as it neared its 20-day moving average. This has been a recurring theme with BTC because the price has essentially traded sideways since mid-June.
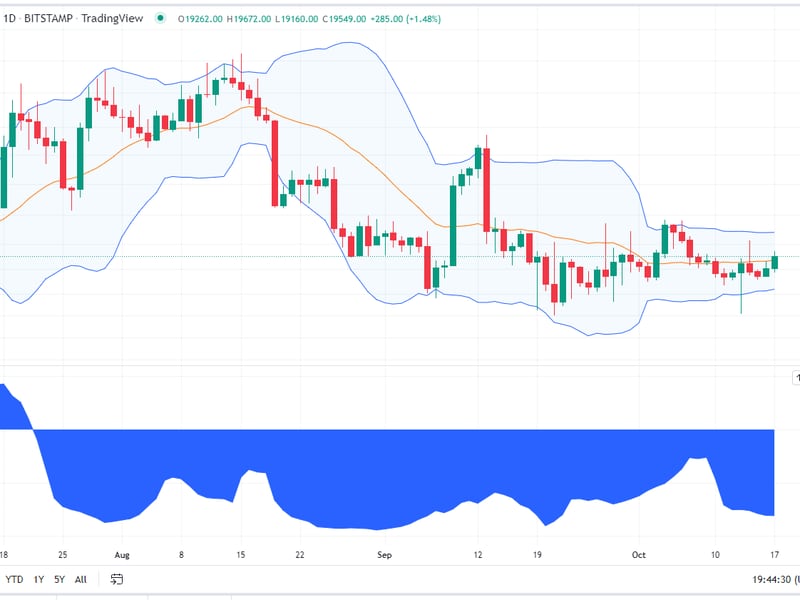
By most technical indicators, BTC still appears poised to trade in its current range in the absence of any dramatic catalysts. Recent data releases, such as the Consumer Price Index report last Thursday, have been relatively non-eventful in the aggregate – providing price volatility intraday before reverting to prior levels.
BTC’s price has breached its 10-day moving average, while the 10-day average appears poised to cross the 20-day moving average. Moving average crossovers are often viewed as bullish signals when they occur to the upside, and bearish when they occur to the downside.
Accounting for BTC’s Bollinger Bands implies, however, that BTC is merely continuing a pattern of moving slightly above the average price before declining, and subsequently moving slightly below average before rising again.
The clearest indication of BTC price movement continues to be its relationship to the U.S. dollar, specifically its inverse relationship to the dollar index (DXY). The correlation coefficient between BTC and the DXY is currently -0.81.
The correlation coefficient measures pricing relationships between assets, with 1 representing a direct relationship and -1 indicating a completely inverse relationship. The maximum negative correlation between the two assets was -0.94 in September.
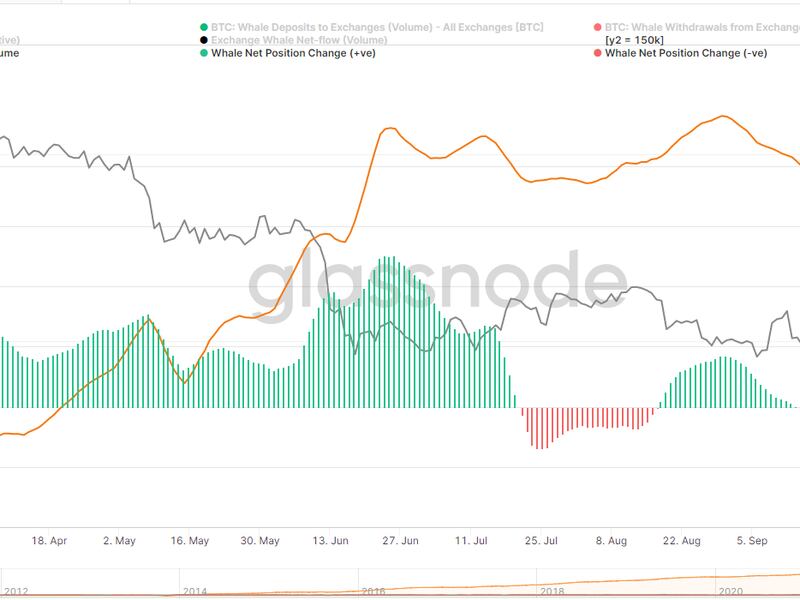
On-chain data is providing early tea leaves that larger BTC holders may be preparing to sell. This would be consistent with recent BTC behavior where profits are scalped after a brief increase above its moving average.
Glassnode’s measurement of “whale” net inflows to exchanges has moved into positive territory after being negative for the prior 30 days. A “whale” is a unique bitcoin entity holding more than 1,000 BTC. Because of their size, whales can sway prices.
The movement of BTC on to exchanges by large investors can signal bearish sentiment, as investors move BTC to exchanges in preparation of selling it.
Altcoin Roundup
- Quant Network's QNT Token Enters Top 30 Crypto List With an Enviable 'Overbought' Status: Interoperability-focused Quant Network's QNT has surged by 450% in four months, decoupling from the broader market lull. Read more here.
- TempleDAO Exploiter Moves Ether Worth Over $2.5M to Tornado Cash: Temple DAO, a decentralized finance (DeFi) protocol that offers users yields on deposits, was hit by a over $2 million exploit last week. The attacker behind the exploit has moved the entirety of the illicitly gained proceeds to privacy mixer Tornado Cash over multiple transactions in the past 24 hours. Read more here.
Trending posts
- Listen 🎧: Today’s "CoinDesk Markets Daily" podcast discusses the latest market movements and a look at a Kanye West story with crypto implications.
- Bitcoin Fails to Produce 1 Block for Over an Hour: An 85-minute block interval left more than 13,000 transactions stuck in a pending state on Monday.
- Ripple Begins Testing XRP Ledger Sidechain That’s Compatible With Ethereum Smart Contracts: This is the first step in a three-part process to introduce an Ethereum Virtual Machine (EVM)-compatible sidechain to the XRP Ledger mainnet.
- Crypto Exchange FTX US Under Investigation by Texas Regulator Over Securities Allegations: The state securities regulator's director said he set up a yield-bearing account on FTX US, despite identifying his address as being located within the U.S.
- Mastercard Joins With Paxos to Help Banks Offer Crypto Trading: Mastercard will verify transactions and help banks follow compliance rules.
- Coinbase Threatens to Sue Crypto Traders Who Profited From Pricing Glitch: A thousand users in the republic of Georgia made wild profits on a Coinbase pricing glitch. Now the U.S.-based crypto exchange wants the money back.
CoinDesk Market Index
Biggest Gainers
| Asset | Ticker | Returns | DACS Sector |
|---|---|---|---|
| Polymath | POLY | +19.72% | DeFi |
| Injective | INJ | +10.54% | DeFi |
| Maker | MKR | +9.77% | DeFi |
Biggest Losers
| Asset | Ticker | Returns | DACS Sector |
|---|---|---|---|
| SushiSwap | SUSHI | -5.94% | DeFi |
| Perpetual Protocol | PERP | -5.42% | DeFi |
| Rally | RLY | -5.16% | Culture & Entertainment |
Sector classifications are provided via the Digital Asset Classification Standard (DACS), developed by CoinDesk Indices to provide a reliable, comprehensive and standardized classification system for digital assets. The CoinDesk Market Index (CMI) is a broad-based index designed to measure the market capitalization weighted performance of the digital asset market subject to minimum trading and exchange eligibility requirements.
Related news

Crypto Rally Foiled by Report of DOJ Probe of Tether

Tokenized Treasuries Like Blackrock's BUIDL Will Challenge Stablecoins But Won't Fully Replace Them: JPMorgan

First Mover Americas: Bitcoin Falls Back Below $68K, Still Outperforms Broader Market

MicroStrategy Touches New Highs as Trading Volume Relative to Nvidia Surges

The Popular $100K Year-End Goal for Bitcoin Has Less Than 10% Probability in Options Market


