Market Wrap: Bitcoin and Ether Rebound Halts 3-Day Losing Streak

Price Action
BTC and ETH Trade Higher to Begin the Week; Overnight Declines Offset by U.S. Markets
Bitcoin (BTC) started the week in positive territory, rising 3% on average trading volume. The largest cryptocurrency by market capitalization rebounded on Monday following three consecutive days of losses.
Ether (ETH), the second-largest cryptocurrency by market cap, was recently up 8.2% , also ending a three-day losing streak.
This article originally appeared in Market Wrap, CoinDesk’s daily newsletter diving into what happened in today's crypto markets. Subscribe to get it in your inbox every day.
Markets appeared to still be digesting Federal Reserve Chairman Jerome Powell’s comments last week in Jackson Hole, Wyoming, although a lack of impactful economic data on Monday may also be contributing to the choppy trading.
Globally, markets will likely note Germany’s inflation data for August, which is scheduled to be released on Tuesday. Expectations are for an 8.2% increase in prices from a year ago. In the U.S., all eyes will be on the August jobs report, which will come on Friday. Analysts expect that the unemployment rate will remain stable at 3.5%.
Powell’s comment last Friday that “in current circumstances, with inflation running far above 2% and the labor market extremely tight, estimates of longer-run neutral are not a place to stop or pause” reinforces Friday’s Market Wrap's commentary that the inflation battle is still ongoing.
The neutral federal-funds rate is the rate where Fed policy is considered to be neither accommodative nor restrictive.
Stocks fell on Monday, with the S&P 500, Dow Jones Industrial Average and tech-heavy Nasdaq Composite dropping 0.6%, 0.7% and 1% respectively.
Crude oil futures increased 4.2%, while natural gas declined 0.4%. Gold, a traditional safe-haven asset, was 0.2% higher. Energy prices are being affected by a looming supply crisis in Europe. Gold appears to be trading down in response to U.S. dollar strength. The dollar index (DXY) for that measure was up 0.4% on Monday. Copper futures, which are viewed as an indication of the overall health of the economy, were down 2.6%.
Altcoins were mixed. Avalanche (AVAX) and Polygon (MATIC) were down 4% and 0.9% respectively, while Uniswap (UNI) was up 4.7%.
Latest Prices
●Bitcoin (BTC): $20,155 +0.8%
●Ether (ETH): $1,539 +3.7%
●S&P 500 daily close: 4,030.61 −0.7%
●Gold: $1,750 per troy ounce +0.8%
●Ten-year Treasury yield daily close: 3.11% +0.07
Bitcoin, ether and gold prices are taken at approximately 4pm New York time. Bitcoin is the CoinDesk Bitcoin Price Index (XBX); Ether is the CoinDesk Ether Price Index (ETX); Gold is the COMEX spot price. Information about CoinDesk Indices can be found at coindesk.com/indices.
Technical Take
BTC and ETH Jump as U.S. Markets Open
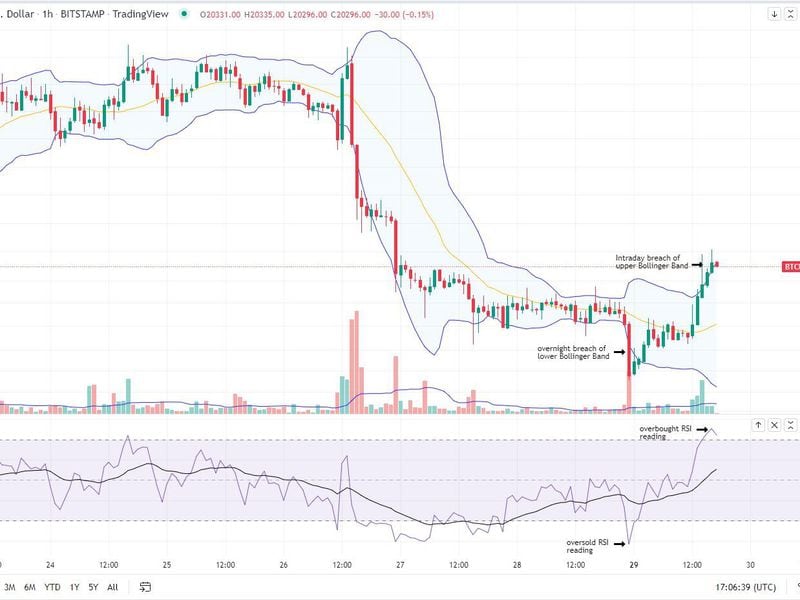
Monday’s hourly BTC chart shows a sharp increase during the 13:00 UTC hour, which coincides with the opening of U.S. markets. Overnight trading shows a pronounced downturn during the 23:00 UTC hour on higher-than-average volume, using the 20-day moving average as the measure for volume.
The relative strength index (RSI) during that hour dipped into severely oversold territory, reaching as low as 18.56. The RSI is a technical indicator used to measure price momentum. Readings below 30 indicate that an asset is oversold (i.e. undervalued). Readings above 70 indicate that an asset is overbought and potentially overpriced.
Also, BTC prices breached the lower end of its Bollinger Band during the 23:00 UTC hour. Bollinger Bands measure an asset's 20-day moving average, and calculate two standard deviations above and below that average.
Traditionally, an asset’s value will remain within two standard deviations 95% of the time. Prices breaching the lower or upper limit of their Bollinger Band often signal that prices have moved too far in one direction.
A look at more recent hourly action shows a reverse of what occurred overnight, as both the RSI and Bollinger Band readings for BTC indicate that prices are overbought.
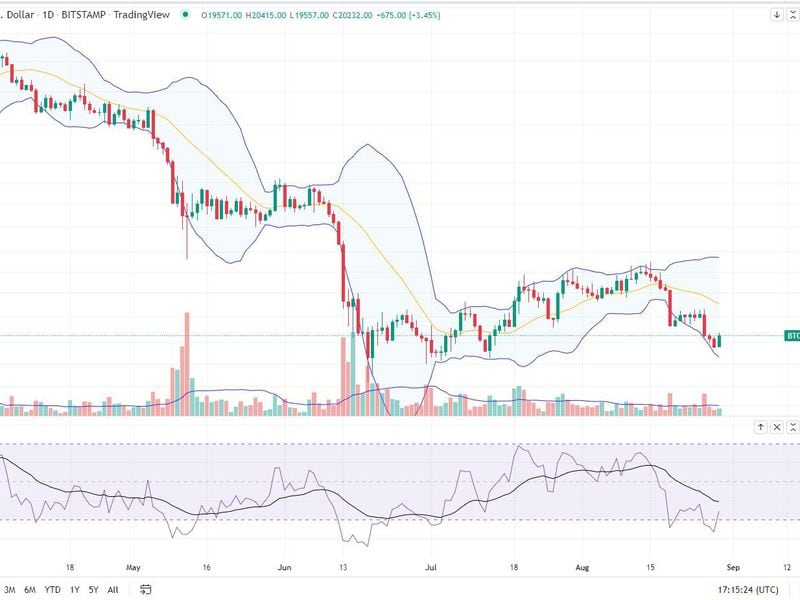
An application of the above chart to BTC’s daily chart shows that BTC is trading about 8% below its 20-day moving average, with an RSI of 35. Traders expecting BTC to revert to its 20-day moving average would be anticipating 8% of upside, were they to add long positions at current levels.
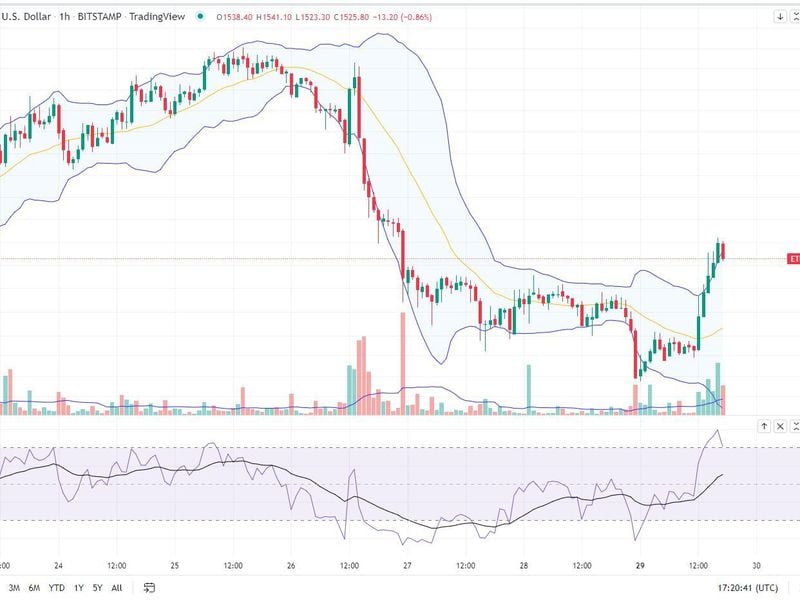
Ether behaved similarly to BTC on Monday, although its prices accelerated at a more rapid pace. ETH saw prices decline sharply during the 23:00 UTC hour on large volume, reaching oversold status on its hourly chart, but the price rebounded during the day to overbought levels.
An application of RSI and Bollinger Bands to ether’s daily chart again shows its similar behavior to BTC on the day, as it has 7% implied upside if its 20-day moving average is the target. ETH’s RSI is slightly higher than BTC’s, at 40.44.
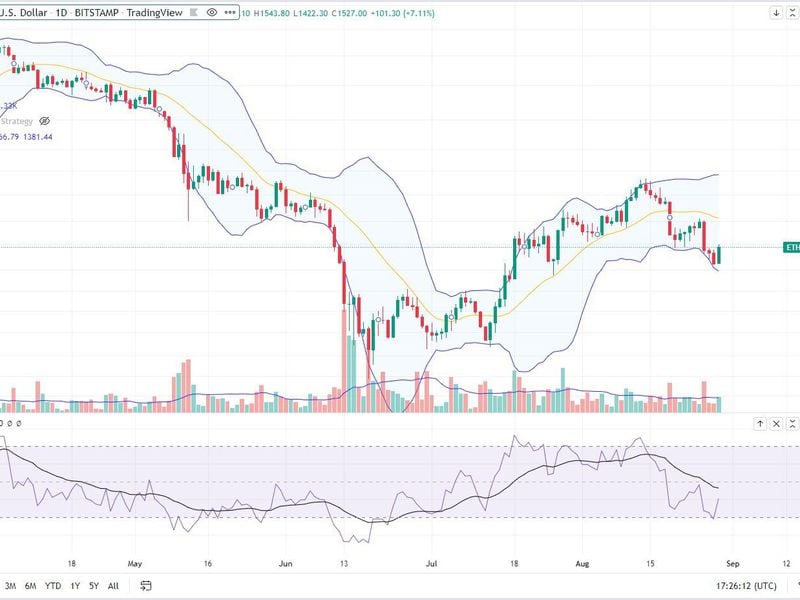
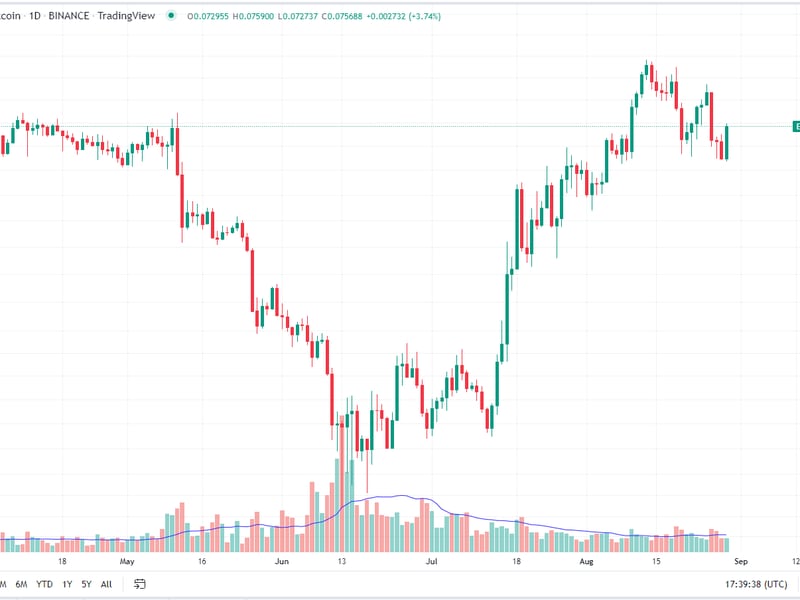
ETH’s outperformance relative to BTC continues a trend that began to take shape in July and is visible on the ETH/BTC pair chart below. The outperformance is likely attributable to the upcoming Ethereum Merge, which is a major software update for the blockchain.
During a deflationary event, the supply of an asset decreases. The asset in turn will generally increase in value from a purely supply-and-demand perspective. Traders wishing to take advantage of this are likely adding ETH prior to the Merge, which is expected to occur next month.
Altcoin roundup
- Crypto Coin AVAX Drops 11% After Self-Described Whistleblower Says Avalanche Weaponized Litigation Against Rivals: Avalanche’s (AVAX) token drops to its lowest price since July 13 even as Ava Labs CEO dismisses accusation as “conspiracy theory nonsense.” Read more here.
- Facebook Joins Meta’s Instagram in Supporting NFTs: Users can now link their crypto wallets and begin posting their non-fungible tokens (NFTs). Read more here.
Relevant insight
- Listen 🎧: Today’s "CoinDesk Markets Daily" podcast discusses the latest market movements and a look at whether or not the Merge is priced into ether.
- FTX’s Sam Bankman-Fried Denies Crypto Exchange Is Planning to Acquire Huobi: Huobi’s native token HT declined about 6% following Bankman-Fried’s tweet.
- Polkadot Parachain Moonbeam Integrates Cross-Chain Messaging Protocol LayerZero: Developing Web3 interoperability via cross-chain messaging has become a growing trend.
- Fintech Firm Lightnet Group Gets $50M From LDA Capital to Boost Velo Protocol's Technology: The firm has the option to raise the total commitment to up to $100 million over the next three years.
- Court Rejects Central African Republic’s Plan to Offer Citizenship for Crypto Investment, Bloomberg Reports: The country wanted to offer citizenship and other benefits in exchange for investing $60,000 in its sango coin.
- Singapore's Central Bank Wants to Foster Digital Assets, Restrict Crypto Speculation: The head of the Monetary Authority of Singapore insists this stance is "synergistic" and says price speculation is the source of the crypto world's problems.
- Grayscale, Disclosing SEC Queries, Says Cryptos XLM, ZEC, ZEN May Be Securities: The three tokens “may currently be a security, based on the facts as they exist today,” Grayscale said in recent, little-noticed filings.
Other markets
Biggest Gainers
| Asset | Ticker | Returns | DACS Sector |
|---|---|---|---|
| Ethereum | ETH | +3.8% | Smart Contract Platform |
| Loopring | LRC | +2.0% | Smart Contract Platform |
| Polkadot | DOT | +1.8% | Smart Contract Platform |
Biggest Losers
| Asset | Ticker | Returns | DACS Sector |
|---|---|---|---|
| Avalanche | AVAX | −3.9% | Smart Contract Platform |
| XRP | XRP | −1.2% | Currency |
| Dogecoin | DOGE | −1.1% | Currency |
Sector classifications are provided via the Digital Asset Classification Standard (DACS), developed by CoinDesk Indices to provide a reliable, comprehensive and standardized classification system for digital assets. The CoinDesk 20 is a ranking of the largest digital assets by volume on trusted exchanges.
Related news

Bitcoin to Account for 7% of Global Wealth, Surge in Price to $13M in 21 Years: Michael Saylor

CoinDesk 20 Performance Update: RNDR's 12% Gain Leads as Index Rebounds

First Mover Americas: Bitcoin Regains $67,000, Adds Nearly 5% in 24 Hours

Elon Musk’s X Quietly Removes Bitcoin, MAGA Emojis From Hashtags

Bitcoin Analysts Express Optimism as Price Nears Resistance Level That Stymied It in May


