Jump in Ether's Relative Strength Index Warrants Your Attention. Here is Why

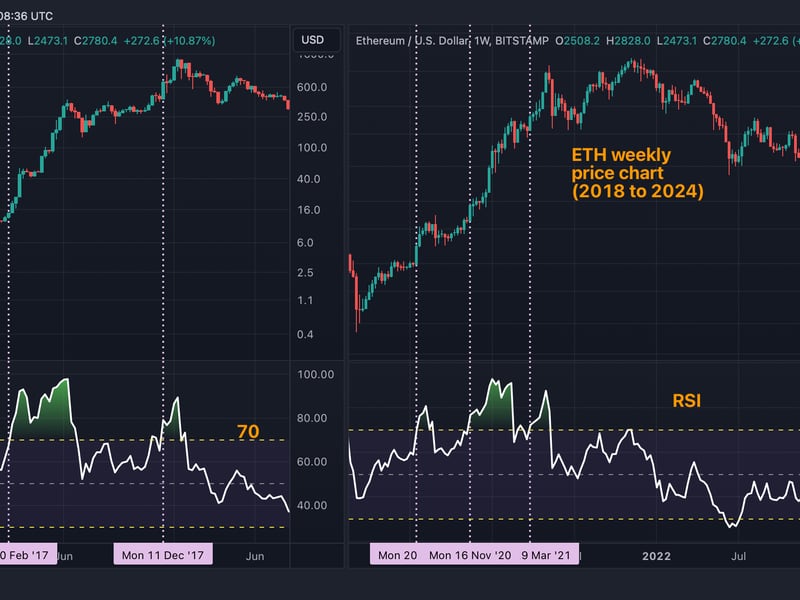
- Ether’s 14-week RSI has topped 70, a threshold that marked previous parabolic bull runs.
- The bullish signal is consistent with excitement surrounding Ethereum’s impending Dencun upgrade and the potential debut of spot ETFs.
Crypto traders may want to pull up ether’s {{ETH}} relative strength index (RSI) on their screens as the popular technical analysis tool is signaling uptrend acceleration ahead.
RSI, developed by J. Welles Wilder, is a momentum indicator that measures the speed and change of price movements over a set period, usually 14 days or 14 weeks.
The indicator oscillates between 0 and 100, with readings above 70, indicating strong upward momentum instead of overbought conditions as popularly perceived. Meanwhile, readings below 30 show strong downward momentum.
EEther’s14-week RSI has crossed above 70. Parabolic bull runs unfolded following similar crossovers in January 2016, February 2017, December 2017, July and November 2020 and March 2021.
The bullish signal on the RSI means ether could play catch up with bitcoin and the broader market.
While ether has rallied 60% to $2,775 since early October, market leader bitcoin and the CoinDesk 20 index have gained 100% and 89%, respectively.
Ethereum has been in the news lately for several reasons, including the debut of the new token standard, ERC-404, which will allow multiple wallets to own fractionalized NFTS, and the impending Dencun upgrade, expected to reduce transaction costs significantly.
Besides, there is excitement about the potential debut of spot-based ETH exchange-traded funds in the U.S. later this year.
Related news

Bitcoin Chops Around $64K, With Japanese Yen's Tumble Maybe Signaling 'Currency Turmoil,' Analyst Says

NEAR and SHIB Led CoinDesk 20 Gainers Last Week: CoinDesk Indices Market Update

First Mover Americas: Bitcoin Holds Stable as ETF Outflows Increase

ARK Sells Last of Its ProShares Bitcoin Futures ETF Shares

Bitcoin Stable Above $64K While ETF Outflows Hit $200M


