Here Are 3 Charts Supporting the Bull Case for Bitcoin

- The global central bank tightening cycle that rocked financial markets, including bitcoin, last year seems to have peaked.
- U.S. financial conditions have eased despite the Fed's higher-for-longer interest-rate mantra.
- The U.S. 10-year Treasury note looks set to extend its recent slide in a positive development for risk assets.
Bitcoin's [BTC] price has risen by 120% this year and most analysts foresee further gains in the near term. They point to expectations the U.S. Securities and Exchange Commission (SEC) will approve one or more spot exchange-traded crypto funds (ETFs) soon and the halving of the Bitcoin blockchain's mining reward, which is due April next year.
The bullish case is also gaining support from the wider economy. The charts below show a positive turnaround in the macroeconomic factors that played a role in last year's price crash.
Global central bank policy cycle
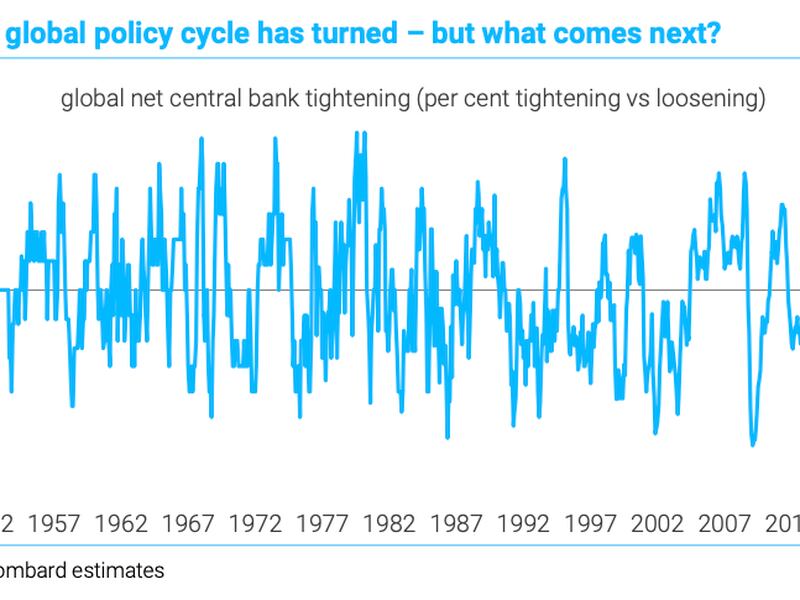
The chart by TS Lombard shows the balance of central banks tightening versus those loosening since 1947. Positive values suggest a net bias for tighter monetary conditions, while negative values indicate a preference for easing.
A loose policy involves boosting liquidity, that is releasing more money into the financial system, through interest-rate cuts and other measures and spurs risk-taking, as observed in 18 months following the coronavirus crash of March 2020. A tighter monetary policy involves sucking liquidity out with interest-rate increases and other tools to tame inflation. It often disincentivizes risk-taking in financial markets, as seen last year.
The plot has recently turned lower, indicating that last year's global tightening cycle that rocked financial markets, including cryptocurrencies, has peaked, and there is now an increasing bias toward liquidity easing.
With inflation rates slowing worldwide, central banks have room to take their feet off the tightening pedal. The move away from tightening could lead to an increased inflow of money into the crypto market. Bitcoin is known to be extremely sensitive to changes in global liquidity conditions and tends to rally when there's more money around.
U.S. financial conditions ease
The chart below shows investment banking giant Goldman Sachs' U.S. Financial Conditions Index (FCI) since January.
The index has tanked from the year's high of 100.74, seen only a few weeks ago, to just under 100, undoing all the tightening witnessed in September and October.
The decline stands opposite the Federal Reserve's higher-for-longer interest-rate stance and hints at a resilient U.S. economy ahead, a positive development for risk assets, including cryptocurrencies. Most of bitcoin's year-to-date gains have occurred during the U.S. trading hours.
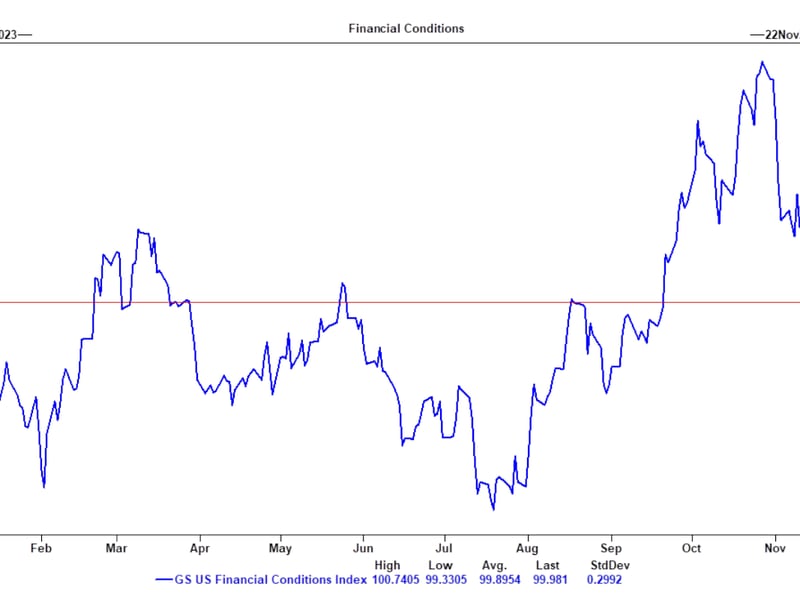
The FCI is a weighted average of short-term interest rates, long-term interest rates, the trade-weighted U.S. dollar exchange rate, an index of credit spreads, and the ratio of equity prices to the 10-year average of earnings per share.
A 1% fall (rise) in the index is known to bring about a 1% positive (negative) GDP impulse in the subsequent three to four quarters.
According to Fed analysts, financial conditions are a “constellation of asset prices and interest rates” that change based on economic health and monetary policy, and which can also potentially affect the economy itself.
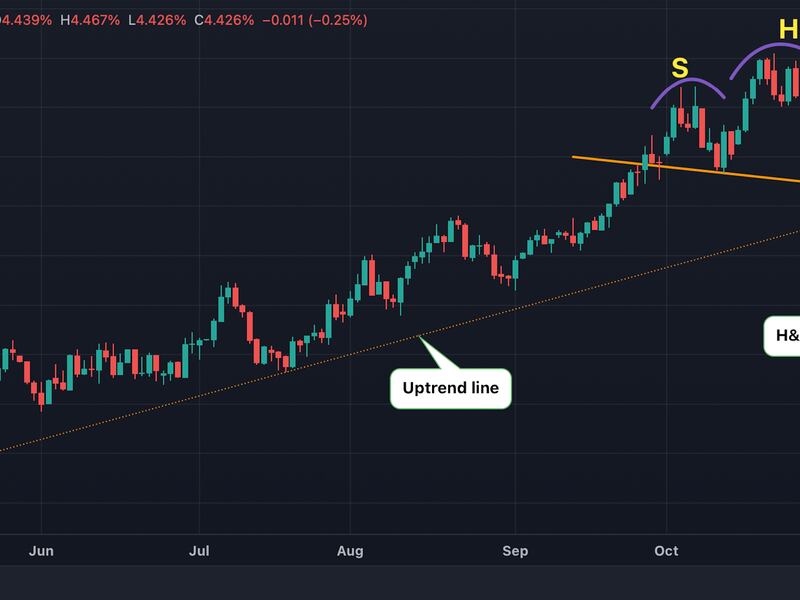
Breakdown in the 10-year Treasury yield
Another positive development for bitcoin is the yield on the U.S. 10-year Treasury note, which has declined by 50 basis points to 4.43% since the Treasury announced a slower pace of bond purchases at the beginning of the month. A decline in the 10-year yield, the so-called risk-free rate, often forces investors to seek higher returns through other assets like stocks and cryptocurrencies.
The 10-year yield could drop further, as the daily chart shows a bearish head-and-shoulders technical analysis pattern.
"10-year yields delivered a lower high (as expected) and broke lower, clearing a head and shoulders top. The pattern yields a target of about 3.93%, but current levels (uptrend) and 4.33% (breakout point) are potential supports too," EFG Bank's research team said in a note to clients this week.
Potential risks
The reversal of tighter financial conditions signaled by Goldman's FCI index could introduce a more hawkish tone into Fed comments, forcing markets to reconsider the possibility of another rate hike in the coming months. That might slow down the pace of bitcoin's rally.
Bulls should also keep an eye on Japan's exit from ultra-easy monetary policy, geopolitical issues, U.S. commercial property concerns, and potential flare-up in inflation as sources of price volatility in risk assets.
Related news

Bitcoin Chops Around $64K, With Japanese Yen's Tumble Maybe Signaling 'Currency Turmoil,' Analyst Says

NEAR and SHIB Led CoinDesk 20 Gainers Last Week: CoinDesk Indices Market Update

First Mover Americas: Bitcoin Holds Stable as ETF Outflows Increase

ARK Sells Last of Its ProShares Bitcoin Futures ETF Shares

Bitcoin Stable Above $64K While ETF Outflows Hit $200M


