Crypto Markets Today: US Regulation Heats Up; Bitcoin Rises, Then Falls

U.S. Senators Elizabeth Warren (D-Mass.) and Roger Marshall (R-Kan.) are introducing a bill to crack down on money laundering and financing of terrorists and rogue nations via cryptocurrency.
This article originally appeared in Crypto Markets Today, CoinDesk’s daily newsletter diving into what happened in today's crypto markets. Subscribe to get it in your inbox every day.
- If it becomes law, the Digital Asset Anti-Money Laundering Act will bring know-your-customer (KYC) rules to crypto participants such as wallet providers and miners and prohibit financial institutions from transacting with digital asset mixers, which are tools designed to obscure the origin of funds.
- The act would also allow the Financial Crimes Enforcement Network (FinCEN) to implement a proposed rule requiring institutions to report certain transactions involving unhosted wallets – wallets where the user has complete control over the contents rather than relying on an exchange or other third party.
- Concerns over the use of crypto to facilitate money laundering and terrorist financing are frequently aired by lawmakers or regulators and are often used to highlight the need for more robust regulation of the digital asset industry.
Token Roundup
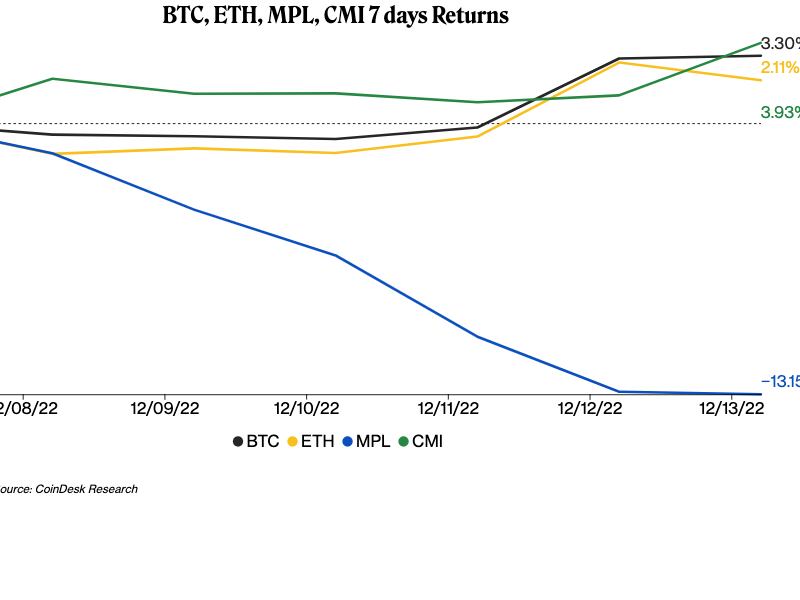
Bitcoin (BTC): The largest cryptocurrency by market capitalization lost hold of earlier gains and was recently trading at $17,800 after the U.S. Federal Reserve raised interest rates another 50 basis points at its last meeting of the year and signaled further increases were likely in 2023. BTC was trading as high as $18,356 right before the Fed’s announcement, over the $18,000 mark for the first time since early November. It’s up 0.5% in the past 24 hours. “Cryptos are getting dragged down as the dollar rallies with the return of risk aversion,” Edward Moya, senior market analyst of the Americas at Oanda, wrote in a Wednesday note.
Equity markets also turned red, with the tech-heavy Nasdaq Composite closing down 0.76%. The S&P 500 was down 0.61% and the Dow Jones Industrial Average was down 0.42%.
Ether (ETH): The second-largest cryptocurrency by market cap after bitcoin similarly followed BTC’s trajectory, sliding around 1% to $1,310 as of publication time. Earlier in the day, PayPal and MetaMask announced the payments company will integrate its buy, sell and hold crypto services with MetaMask Wallet as the companies look to broaden users' options to transfer digital assets from their platforms. Users will be able to buy and transfer ETH from PayPal to MetaMask.
Maple (MPL): Blockchain-based lending platform Maple Finance unveiled Wednesday a major protocol overhaul in an attempt to improve on shortcomings highlighted by a spate of recent loan defaults. The upgraded version includes improvements on the withdrawal request process, introducing an option to schedule and prorate withdrawals. Maple Finance's native MPL token was trading up as much as 6.9% in the past 24 hours on the news before falling back a 1.7% advance to $3.80, according to price tracking site CoinGecko
Latest Prices
Crypto Market Analysis: Focus on Bitcoin's Price Charts, Not Hawkishness From Fed's Powell
By Glenn Williams Jr.
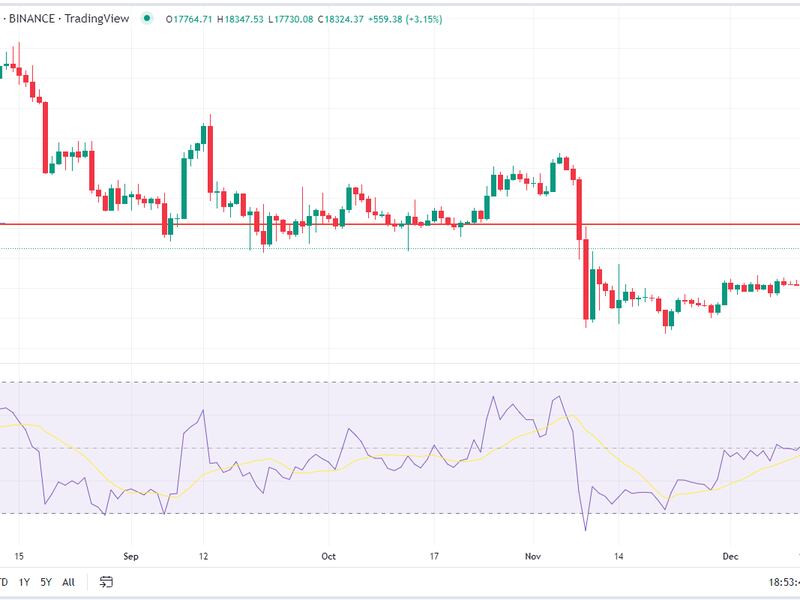
Let’s unpack this week’s move up past $18,000 for the first time since Nov. 10. Does the move have real merit, or is it just a short term relief rally? It could be that – just the mere fact that we're asking the question is a sign for optimism.
Historically, on a seasonal basis, the market is not entering a time of the year of strong performance. From a price-chart perspective, bitcoin’s roughly $17,900 level moves the asset into a “low volume node” region – possibly indicating the potential for quick price moves.
Volume nodes can be identified as zones on a price chart using the Volume Profile Visible Range tool, showing trading activity by price point. A high volume node represents areas of significant price agreement, which often coincides with slower price movement.
By contrast, low volume nodes represent areas of low activity. Prices have the tendency to move rapidly through these areas until they reach the next area of agreement. An illustration of this can be seen in the 14% decline that took place on Nov 9. Bitcoin has now entered that same space, but to the upside this time around.
Read the full technical take here.
Trending posts
- Listen 🎧: Today’s "CoinDesk Markets Daily" podcast discusses the latest market movements and a look at legislative hopes for crypto in the new year.
- FTX Bankruptcy Court Is Warned Against Granting Bahamas 'Dangerous' IT Access
- FTX Hearing in US Senate Reveals Congress Doesn’t Have Immediate Answers
- Binance CEO Changpeng 'CZ' Zhao Warns Staff of Turbulent Times
- As Bitcoin, Stock Investors Cheer US Inflation Slowdown, One Macro Expert Calls for Caution
- Bitcoin Miner Core Scientific's Lender Wants to Give Miner $72M to Avoid Bankruptcy
- Citi Says Crypto Market Leverage, Open Interest Are Historically Low
- Celsius Seeks $7.7M From Voyager's Estate as Bankruptcy Cases Intertwine
Related news

Bitcoin Chops Around $64K, With Japanese Yen's Tumble Maybe Signaling 'Currency Turmoil,' Analyst Says

NEAR and SHIB Led CoinDesk 20 Gainers Last Week: CoinDesk Indices Market Update

First Mover Americas: Bitcoin Holds Stable as ETF Outflows Increase

ARK Sells Last of Its ProShares Bitcoin Futures ETF Shares

Bitcoin Stable Above $64K While ETF Outflows Hit $200M


