Bitcoin's Pre-Fed Weakness Has Chart Analysts Focused on Support at $18.3K

Bitcoin (BTC) is on the defensive ahead of a pivotal Federal Reserve decision on Wednesday on interest rates and appears to be on track to test support at $18,300, which, if breached, could make the bear market worse, according to technical analysis by Katie Stockton, founder and managing partner at Fairlead Strategies.
The leading cryptocurrency by market value was changing hands at $18,850 at press time, a 3.5% drop on the day, according to CoinDesk data.
A week ago, bitcoin failed to break the confluence of a 10-month-long descending trendline and resistance outlined by a Japanese charting tool called the Ichimoku cloud, which was just above $22,000. That put the bears back into the driver's seat.
"Bitcoin saw a negative reaction to last week's CPI data, yielding an unsuccessful test of initial resistance at the daily cloud model ($22,000)," Stockton wrote in a note to clients Monday, referring to the consumer price index.
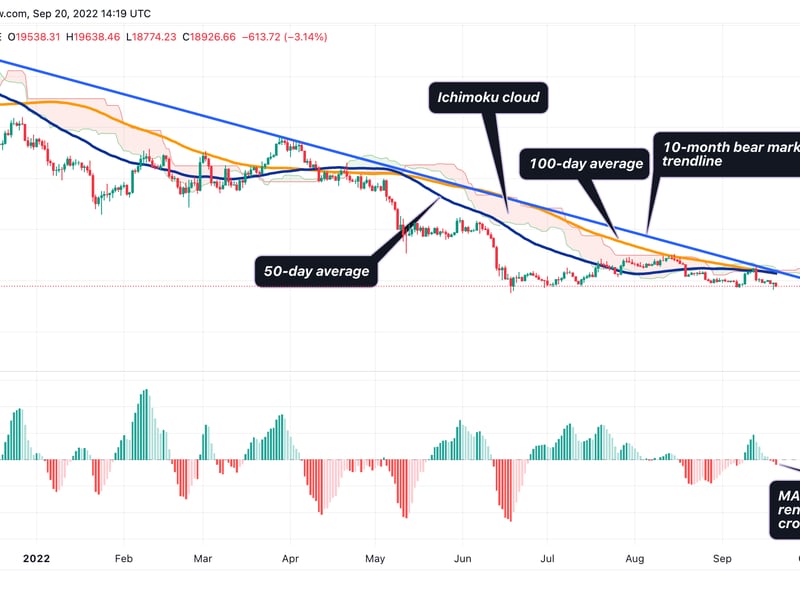
On the daily chart, the moving average convergence divergence (MACD) histogram, an indicator used to identify trend changes and trend strength, has dropped below zero, confirming a renewed bearish crossover.
"Short-term momentum has shifted negative per a new daily MACD ’sell’ signal, increasing risk as long-term support ($18,300) is tested," Stockton said.
The so-called sell signal comes after bull failure at the descending trendline, Ichimoku cloud resistance and the 50- and 100-day moving averages.
The Ichimoku cloud, which was created by Japanese journalist Goichi Hosoda in the late 1960s, comprises two lines – the leading span A and the leading span B. Both lines are plotted 26 days ahead of the last candle to indicate future support or resistance.
Crossovers above or below the cloud are widely taken to represent early signs of a bullish or bearish trend change, while failure to top the cloud resistance, as in BTC's case, is said to reinforce bearish trends.
The focus now is on the Fibonacci retracement level of $18,300, as seen in the weekly chart below.
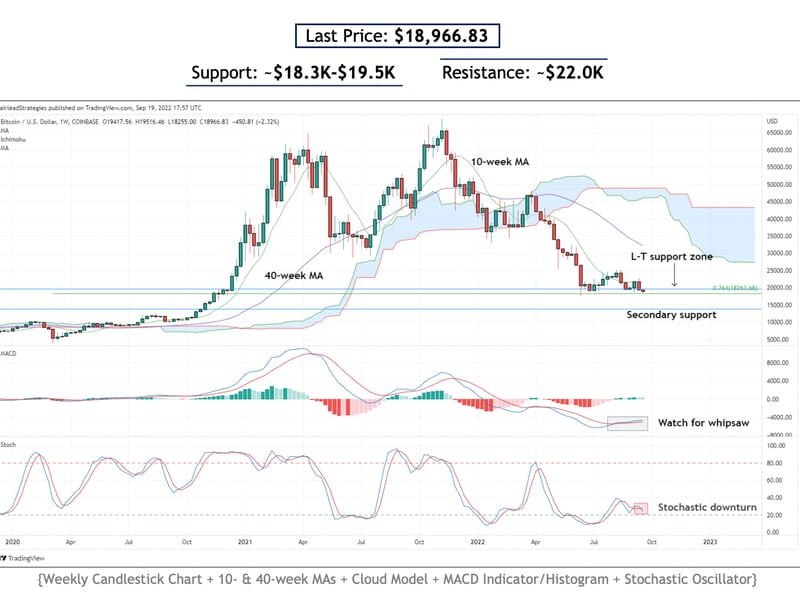
"Two consecutive weekly closes below $18,300 would mark a breakdown in a bearish development, increasing downside risk to secondary support near $13,900," Stockton noted, adding that negative long-term momentum is growing, according to the monthly chart MACD histogram. A weekly close means the price traded on Sunday at 23:59 coordinated universal time (UTC).
A break below $18,300 can bring more substantial selling pressure, as Delphi Digital's volume profile analysis shows that most trading transactions of the past three months have occurred above bitcoin's current market price.
If the support is breached, long positions may be squared off, adding to bearish pressures in the market.
"Almost everyone who has bought and held bitcoin over the last three months (and over the last two years by default) is now underwater, or offsides in their positioning to some degree," Andrew Krohn, a research analyst at Delphi Digital, said in a note to subscribers.
"Should prices continue to move against the majority of participants, positions will need to unwind," Krohn added.
Related news

Bitcoin to Account for 7% of Global Wealth, Surge in Price to $13M in 21 Years: Michael Saylor

CoinDesk 20 Performance Update: RNDR's 12% Gain Leads as Index Rebounds

First Mover Americas: Bitcoin Regains $67,000, Adds Nearly 5% in 24 Hours

Elon Musk’s X Quietly Removes Bitcoin, MAGA Emojis From Hashtags

Bitcoin Analysts Express Optimism as Price Nears Resistance Level That Stymied It in May


