Bitcoin's Bull Run Has Plenty of Steam Left, These Indicators Suggest

- Cognitive biases like anchoring may see investors anticipate a BTC price slide in the wake of this year’s 150% rally.
- Indicators like Puell Multiple, MVRV Z-Score, and Mayer Multiple suggest bitcoin is far from being overvalued and could continue to rally in 2024.
Bitcoin [BTC], the leading cryptocurrency by market value, has surged over 150% this year, beating traditional assets like the S&P 500, gold, and the U.S. dollar by a huge margin.
That may have some investors, particularly those who haven’t seen the previous crypto bull runs and are “anchored” to the brutal bear market of 2022, intuitively view the cryptocurrency as being overvalued and anticipate a price slide in the coming months. Anchoring is a cognitive bias that causes investors to rely overly on recent or initial data while making future judgments.
Traditional finance investors who want exposure to bitcoin could fall victim to the anchoring bias and intuitively wait for cheaper entry prices. That’s because, in conventional markets, assets rarely double in value in less than a year. Besides, investors, in general, are vulnerable to loss aversion, a cognitive behavior of booking out of winning trades early and holding on to loss-making bets for longer.
Believing in the aforementioned cognitive biases, however, could prove costly as three indicators – tracking activity on the Bitcoin blockchain, miner flows, and the 200-day moving average – suggest the cryptocurrency has plenty of upside left.
Let’s discuss these indicators in detail.
Puell Multiple
The Puell Multiple measures the U.S. dollar value of the daily bitcoin issued relative to the 365-day moving average of the dollar value of the issuance. The issuance here refers to the current supply, i.e., minted or new coins released to the network. Since the last halving in early 2020, miners have minted roughly 900 tokens per day.
Elevated readings indicate that the present profitability of miners is high compared to the yearly average, and hence, they could liquidate their holdings at a faster pace, adding to bearish pressures in the market. Low readings suggest otherwise.
In the past, readings above four have coincided with market peaks, with values reaching as high as 10 in early bull cycles. Meanwhile, multiples of less than 0.5 have hinted at market bottoms.
As of the time of writing, the Puell Multiple stood at 1.53, well short of the red zone above four, according to data tracked by Glassnode.
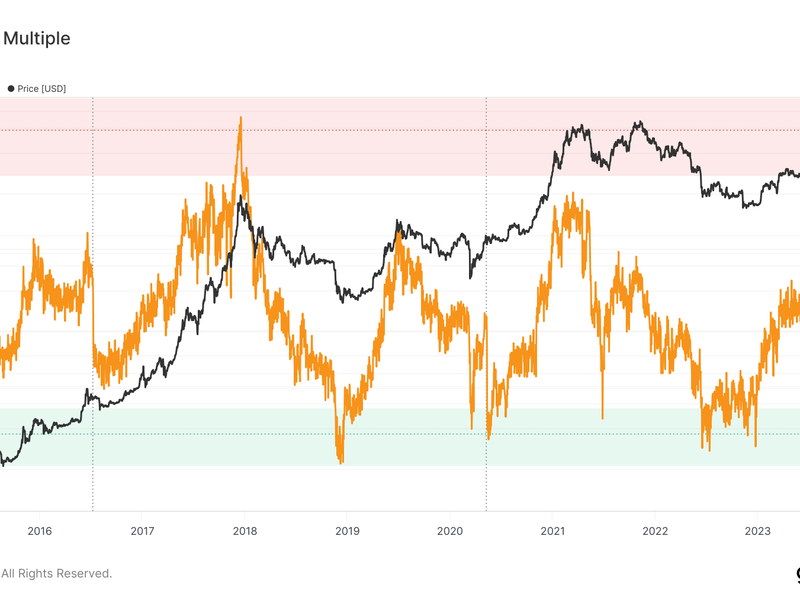
The indicator could slide back into the accumulation zone (below 0.5) early next year after bitcoin’s mining reward halving. The inbuilt code will cut the per-block issuance of bitcoin to 3.25 BTC from 6.5 BTC.
“Because the quantity of BTC issued in the subsidy literally gets cut in half, the only way for this metric to recoup so quickly is for the price of BTC to rapidly increase,” analysts at Blockware Intelligence said in the latest edition of the weekly newsletter.
“The next halving is estimated for March 2024. That’s not too far away at all,” analysts added.
MVRV Z-score
The Z-score of bitcoin's market value-to-realized value (MVRV) ratio shows how many standard deviations the assets' market capitalization differs from its realized or fair value.
The market capitalization is obtained by multiplying the total number of tokens in circulation by the going market price. The realized value is a variation of the market cap, which can be calculated by dividing the value of all bitcoins at the price they were last moved on-chain by the number of coins in circulation. The metric excludes coins lost from circulation and is said to reflect the fair value of the network.
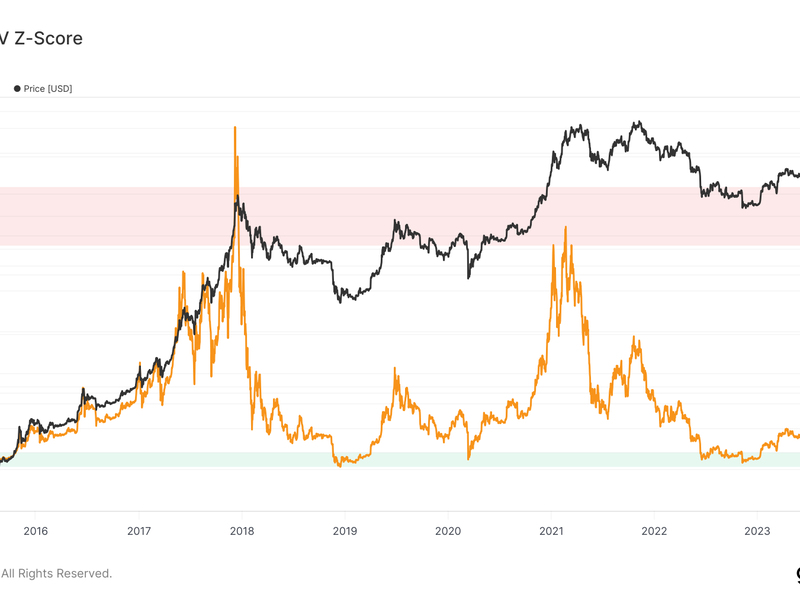
At press time, the Z-score stood at 1.6, indicating that the cryptocurrency is far from being overvalued and may continue to rally next year, as anticipated by several analysts.
Historically, Z-scores above eight have signaled overvaluation and signaled bull market tops, while negative values have signaled discounted prices and bear market bottoms.
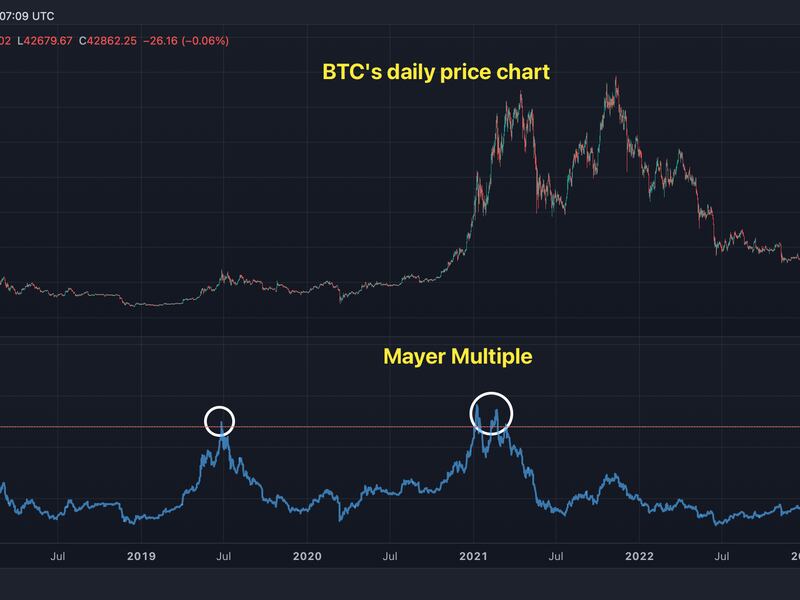
Mayer Multiple
The Mayer Multiple, developed by bitcoin investor and podcast host Trace Mayer, measures the difference between bitcoin's going market price and the 200-day simple moving average (SMA).
The indicator helps identify overbought and oversold conditions by comparing the present market price with its 200-day moving average. The assumption is that the market will revert to its mean or the 200-day SMA after extended bullish/bearish trends push the multiple above 2.4/below 0.5.
As of the time of writing, the Mayer Multiple was 1.404, meaning bitcoin’s price at $42,937 was 1.4 times its 200-day SMA at $30,563.
In other words, bitcoin has plenty of room to rally before we can say it’s overbought relative to its 200-day SMA. The 200-day SMA is one of the most widely tracked gauges of long-term trends. As per technical analysis, an asset is said to be in a bull market once its value drops above the 200-day SMA and vice versa.
Related news

Bitcoin Chops Around $64K, With Japanese Yen's Tumble Maybe Signaling 'Currency Turmoil,' Analyst Says

NEAR and SHIB Led CoinDesk 20 Gainers Last Week: CoinDesk Indices Market Update

First Mover Americas: Bitcoin Holds Stable as ETF Outflows Increase

ARK Sells Last of Its ProShares Bitcoin Futures ETF Shares

Bitcoin Stable Above $64K While ETF Outflows Hit $200M


