Bitcoin Technical Indicator Signals Big Moves With Some Traders Getting Ready to 'Sell Volatility'

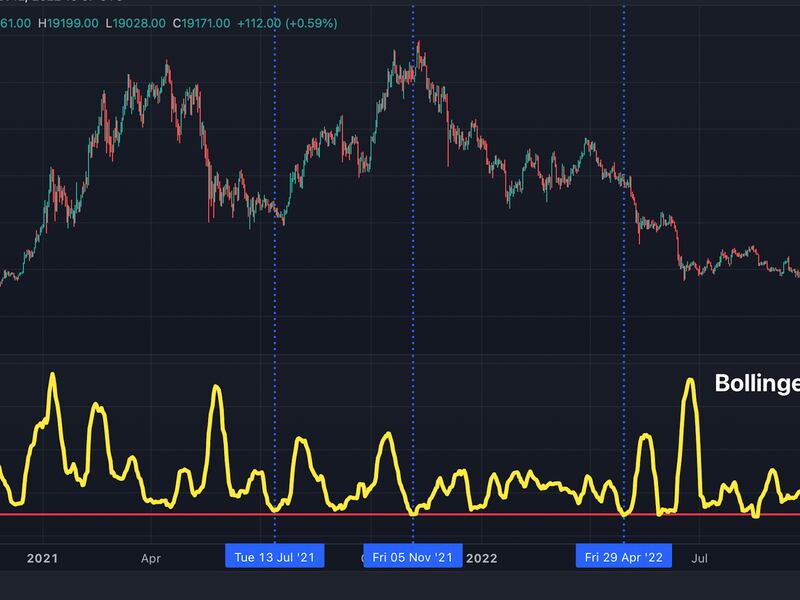
Bitcoin (BTC) traders will soon get the one thing they love the most: market volatility. That's the signal from a technical indicator called Bollinger bandwidth, which is used to gauge periods of high and low volatility and shifts in volatility trends.
The indicator is calculated by dividing the spread between the Bollinger bands by the 20-day average of the cryptocurrency's price. Bollinger bands are volatility lines placed two standard deviations above and below the 20-day average of price.
The bandwidth falls, indicating low volatility when standard deviation bands contract. On the flip side, the bandwidth rises, implying a pick up in volatility when the bands expand.
Volatility is said to be mean-reverting, which means periods of high volatility are often followed by dour price action, while a low volatility environment usually ends with increased price turbulence.
Since the end of June, the bitcoin market has seen a volatility meltdown, with the bandwidth indicator falling from 0.76 to 0.08, the lowest since October 2020.
Therefore, a big move in either direction appears overdue – more so, as historically, below-0.10 readings on the bandwidth have marked an explosion in price volatility.
Bitcoin has been trading in the narrow range of 18,500 to $20,500 for nearly a month, CoinDesk data show.
Good time to buy volatility (or options)?
When anticipating a big move in either direction, sophisticated traders build a "net long volatility" portfolio so that their investment's value increases when the price movements become rapid.
One common strategy employed by seasoned traders is to buy options – either a call or put or both. That's because a pickup in price turbulence has investors scrambling for hedges. That boosts demand for options, making them pricier.
However, most traders do so when options appear cheap – a situation where expected or implied volatility already priced in the options market is lower than historical or realized volatility. Seasoned traders sell options or go short on volatility when implied volatility is far greater than realized volatility.
At press time, short duration options appear costlier, with the seven-day implied volatility greater than realized volatility. More importantly, the gap between the two, known as the variance risk premium, has recently widened.
"This would be a better time to sell volatility [sell options] than bet on a volatility explosion higher," Gregoire Magadini, CEO of options analytics platform Genesis Volatility, told CoinDesk. "The variance risk premium has grown bigger, and so options are still more expensive despite overall volatility being lower."

Markus Thielen, head of research and strategy at crypto services provider Matrixport, said markets are overestimating a pick up in volatility in the crypto market following the release of the U.S. inflation report on Thursday.
"This year, ether has declined by 1.5% on average in the week after inflation releases. The options market is currently pricing a post-inflation move of +5/-5% in ether," Thielen said. "I would argue that the market is overpricing expected volatility and so I would be a volatility seller here."
"My favorite trade is to sell the ether $1,200 Oct 21 expiry put and sell the ether $1,400 Oct 21 expiry call," Thielen added. Traders sell call and put options when expecting a range-bound market.
Also read: Bitcoin Options Traders, Burned by Last Month’s CPI Report, Now Seek Downside Protection
Related news

Bitcoin Chops Around $64K, With Japanese Yen's Tumble Maybe Signaling 'Currency Turmoil,' Analyst Says

NEAR and SHIB Led CoinDesk 20 Gainers Last Week: CoinDesk Indices Market Update

First Mover Americas: Bitcoin Holds Stable as ETF Outflows Increase

ARK Sells Last of Its ProShares Bitcoin Futures ETF Shares

Bitcoin Stable Above $64K While ETF Outflows Hit $200M


