Beware of Bitcoin's 'Rising Wedge,' Chart Analyst Says

- Bitcoin’s rising wedge pattern suggests potential for price pullback, according to crypto analyst Josh Olszewicz.
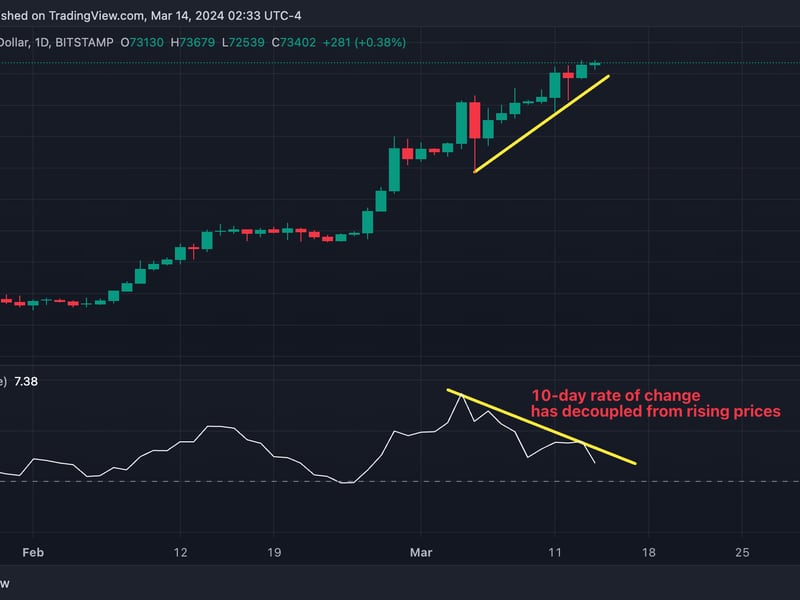
- The cryptocurrency’s 10-day rate of change has decoupled from rising prices.
A key price pattern has emerged on bitcoin’s {{BTC}} price chart, hinting at a potential pullback ahead.
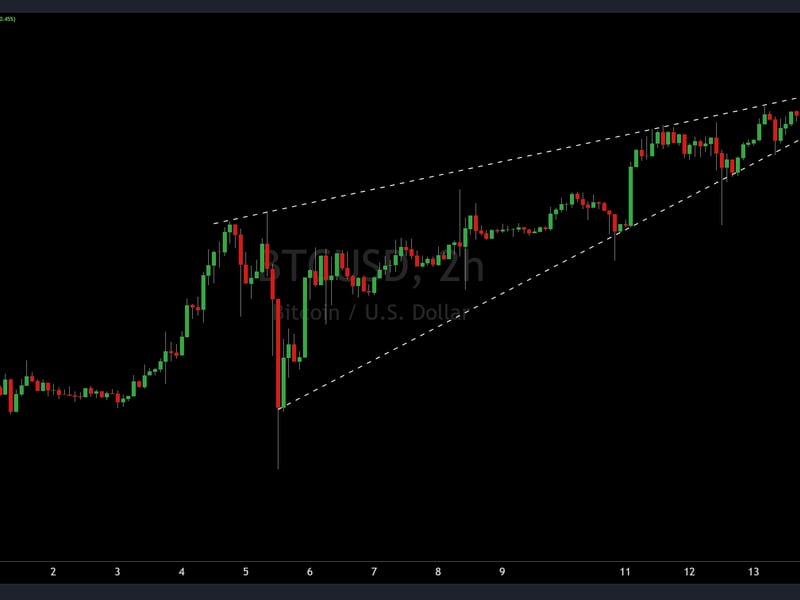
The cryptocurrency has rallied from $60,000 to new record highs above $70,000 in less than two weeks. The ascent has taken the shape of a “rising wedge,” which is a bearish pattern, according to technical analysis theory.
“Normally rising wedges resolve bearish,” crypto analyst and trader Josh Olszewicz told CoinDesk, explaining a possibility of a typical bull market pullback ahead.
A rising wedge pattern comprises upward-sloping trendlines that connect highs and lows and converge toward a single point known as the apex. The converging nature of trendlines indicates a steady weakening of bullish momentum. Thus, an eventual wedge breakdown, or the move below the trendline connecting lows, represents a bearish development, paving the way for deeper price losses.
Other indicators like the 10-day rate of change, which measures how rapidly prices are surging or falling over 10 days, have decoupled from the rising prices.
The divergence suggests a downside momentum is building and often foreshadows price pullbacks. 20% or more pullbacks were common during the 2017 and 2020-21 bull markets.
However, Olszewicz expects the pullback to be short-lived. “Given the ETF inflows coming in and MicroStrategy’s Saylor continuing to buy more, I think even if prices do retrace after potential wedge breakdown, it will be hard for the bears to keep them under pressure for long,” Olszewicz explained.
Related news

Bitcoin Chops Around $64K, With Japanese Yen's Tumble Maybe Signaling 'Currency Turmoil,' Analyst Says

NEAR and SHIB Led CoinDesk 20 Gainers Last Week: CoinDesk Indices Market Update

First Mover Americas: Bitcoin Holds Stable as ETF Outflows Increase

ARK Sells Last of Its ProShares Bitcoin Futures ETF Shares

Bitcoin Stable Above $64K While ETF Outflows Hit $200M


