As Crypto Grows, so Does CoinDesk’s Commitment to Keeping Pace

Proximity to information and access to new tools is one of the things that I value most about being at CoinDesk. Each day there’s cutting-edge access to news and early looks at tools that we as a firm are looking to bring to the marketplace.
The new Bitcoin Trend Indicator (BTI) from CoinDesk Indices is useful for investors, specifically those looking to employ systematic, non-discretionary strategies. Successful and timely identification of trends in price movements is paramount to any active investing strategy – and that’s something BTI appears to deliver.
While this new tool might not be so useful for investors engaging in a long-term, buy-and-hold strategy, for those with a tactical bent – a penchant for entering and exiting positions quickly – it’s got significant value. It should work well in tandem with watching seasonality, which is particularly important following the crypto winter markets endured for much of 2022.
You’re reading Crypto Long & Short, our weekly newsletter featuring insights, news and analysis for the professional investor. Sign up here to get it in your inbox every Wednesday.
As a practitioner of technical analysis, I view visual identification as a tried-and-true method of identifying trends. You pull up a chart, observe the extent to which prices are moving and apply trend lines to provide a graphical outline of those trends. They can effectively be used to identify and project the direction of an asset’s price movement, with breaks below or extensions above being instances worth noting.
- An application of this directional identification approach would likely identify bitcoin’s (BTC) uptrend since January, following a two-month period of relatively flat, range-bound trading.
- Breaks of the trendline can be seen in early March and April 19, when BTC took a brief pause amid its massive 74% gain to start 2023.
- Similar patterns appear for ether (ETH), given its 53% recent uptrend and trendline breaks occurring on the same dates.
Candidly, a degree of subjectivity exists when drawing trendlines. Where I draw my trendline may be completely different from where a colleague draws one. Methodology can vary as well. Where one may connect trend lines at an asset’s closing price, another may draw the trendline at its high or low price for the day.
This is not meant to call into question the practice itself, but to highlight potential variations in the analysis of identical data. From my vantage point, it’s no less subjective in nature than picking one valuation multiple over another when performing fundamental analysis.
Historical price data can be used to identify seasonality and trends as well. Past pricing data can be separated into buckets related to time, and used to identify patterns.
- For example, pulling daily price data for BTC from 2014 shows that October has produced the highest average daily return in comparison to other months, a gain of 0.53% per day. The worst month has been September (a 0.16% average loss), with a stretch of consecutive average positive daily returns existing from February to August historically.
- Not surprisingly, ETH has demonstrated similar behavior, although its stretch of consecutive positive months is narrower, with the longest one occurring from October to December.
Investors can also narrow the time period of evaluation to a more recent time frame to evaluate the extent to which performance may have shifted.
Of note in 2023 is the somewhat sporadic monthly returns, with underperformance in February and April, surrounded by outperformance in January and March. The lack of a discernible trend in instances like this highlights the need for objective, quantitative-based tools to evaluate trends. As crypto matures and the base of crypto investors widens, so, too, will the need for tools that strip the emotion out of allocation decisions. CoinDesk’s Bitcoin Trend Indicator can do that.
In a nutshell, the BTI identifies the “presence, direction and strength of momentum in the price of bitcoin.” It is calculated daily at 4 p.m. ET (20:00 UTC at this time of year), using prices from the CoinDesk Bitcoin Price Index (XBX), our BTC benchmark.
The five BTI signals, (color coded for clarity from red to green) are significant downtrend, downtrend, neutral, uptrend and significant uptrend.
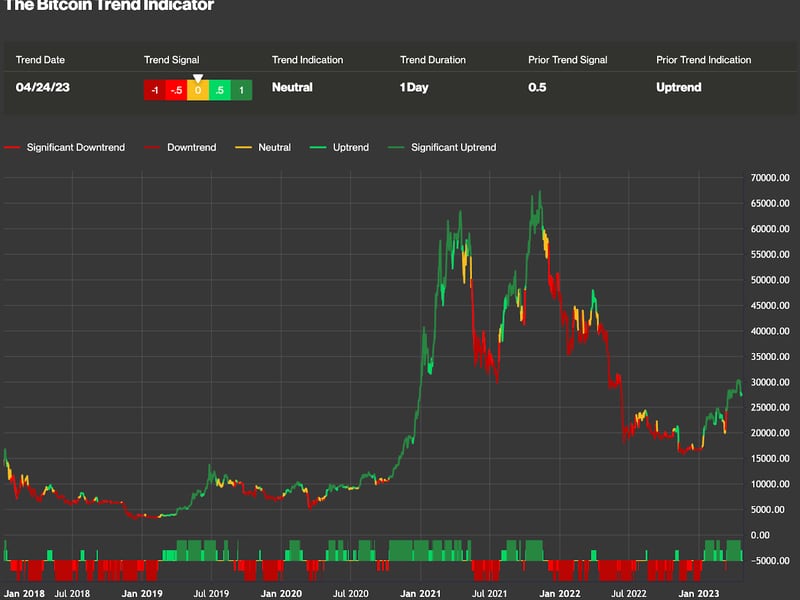
A look into its methodology shows that a series of moving average crossovers are utilized within four distinct crossover windows of varying lengths. Exponential weighting is used to fully capture the importance of more recent prices.
A backtest of the BTI shows it identified an uptrend in October 2020, before BTC jumped to $40,000 from $10,000. From a risk management vantage point, it also identified movement to “neutral” from “uptrend” in May and November 2021, before substantial drawdowns.
A missed signal can be seen in late March 2022, when the BTI signaled an uptrend before a 59% drop through June. It’s also worth noting, however, that while the uptrend was identified on March 28, the BTI identified a neutral signal on April 8 and a downtrend signal on April 10.
There is no Holy Grail indicator, so I expect other false signals. I find comfort seeing that the BTI has demonstrated an ability to quickly adapt to a changing landscape however.
I would encourage all who are reading this to give the BTI a look, particularly those who are looking to build systematic, non-discretionary strategies.
Give it a try, poke holes in it, completely ignore any bias that I may have towards it and see how it fits into your own investment process. Feel free to let us know how you feel as well, whether positively or negatively. Feedback can be the lifeblood of improved processes.
Our goal at CoinDesk is to constantly provide products and services that add value to your own.
Takeaways
From CoinDesk Deputy Editor-in-Chief Nick Baker, here’s some news worth reading:
- GEMINI’S GAMBIT: Gemini, the Winklevoss twins’ crypto exchange, plans to open a derivatives platform outside the U.S. – initially offering bitcoin perpetual contracts. Gemini’s bigger rival, Coinbase, is also toying with the idea of setting up shop outside the U.S. It’s really no surprise at all that U.S.-based crypto businesses are thinking overseas thoughts as American regulators crack down hard on the industry. The question is whether folks in Washington really want to risk forcing crypto onto foreign turf. For all the anti-crypto talk from the likes of Sen. Elizabeth Warren (D-Mass.), there’s plenty of support for aspects, at least, of the industry from conventional financial circles and other politicians.
- MORE COINBASE: Coinbase isn’t just mulling whether to create an exchange outside the U.S. It is asking a court to compel its regulator, the Securities and Exchange Commission (SEC), to finally decide on whether existing securities laws apply to digital assets. This appears to be a preemptive move by Coinbase to argue that the SEC hasn’t given enough guidance for U.S. crypto companies.
- WAKING UP: A strange thing has been happening lately with bitcoin. Several large wallets with roots in the early days of this whole blockchain experience have begun waking up and are moving BTC around. Why these whales have awakened is far from clear, though there’s some speculation they’ve been cracked by nefarious actors. Yes, security still matters in crypto.
- ETH’S HANGOVER: Ether (ETH) rallied strongly earlier this month after the Ethereum network was upgraded to allow staked ETH to be unstaked. But that rally, which arguably made ETH more appealing to investors by removing a major obstacle, has now basically disappeared.
To hear more analysis, click here for CoinDesk’s “Markets Daily Crypto Roundup” podcast.
Related news

Bitcoin Chops Around $64K, With Japanese Yen's Tumble Maybe Signaling 'Currency Turmoil,' Analyst Says

NEAR and SHIB Led CoinDesk 20 Gainers Last Week: CoinDesk Indices Market Update

First Mover Americas: Bitcoin Holds Stable as ETF Outflows Increase

ARK Sells Last of Its ProShares Bitcoin Futures ETF Shares

Bitcoin Stable Above $64K While ETF Outflows Hit $200M


