Crypto Long & Short: Bitcoin's 'Golden Cross' Explained

This week, Glenn Williams Jr. addresses one of the hotter debates in cryptocurrencies at the moment: How traders should feel about bitcoin and ether possibly achieving a “golden cross,” a popular indicator from technical analysis.
Then, Todd Groth, head of index research at CoinDesk Indices, addresses how hugely bullish a wide range of assets have gotten, and where the Federal Reserve fits into this.
The ‘Golden Cross’ Sounds Important for Crypto Traders, but Is It?
Many in the crypto investing realm are excitedly worked up as bitcoin (BTC) nears the vaunted “golden cross.” For those unfamiliar with this price-charting technique, a golden cross happens when a shorter-term moving average (often the 50-day) crosses above a longer-term one (frequently the 200-day).
It’s a fairly common indicator used often by technical analysts, viewed as an indication of a newly forming bull market. As a technician myself, moving average crossovers are certainly something that I pay attention to. Why is it thought-provoking? It puts the current moment into a bigger-picture perspective, prompting you to ask, “What has changed in the short-term to accelerate price movement and is that something I expect to carry on?”
But how good is it as a forecasting tool? It’s one thing to identify a moving-average crossover and state, “This is bullish.” It's something entirely different to see if it actually has been.
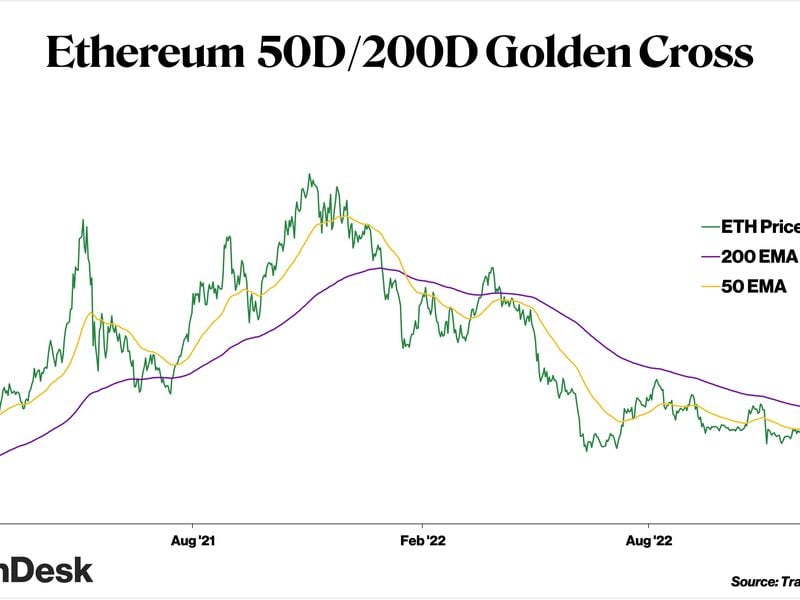
As I examine the history of bitcoin, what stands out to me most is just how few times a golden cross has occurred. Since Jan. 1, 2015, there are just six instances when the 50-day exponential moving average (EMA) crossed above the 200-day EMA. (Exponential moving averages give higher weight to more recent prices, whereas simple moving averages equally weight all data points. The use of one versus the other is a matter of personal preference.) It’s even more rare for Ethereum’s ETH, which has experienced just three golden crosses since 2017.
But both are close to doing it again, with BTC 2.4% away from one and ETH 2.1%. The point in looking at them now is to determine whether the assets are approaching something worth paying attention to, or whether it's simply something to talk about. The results are interesting.
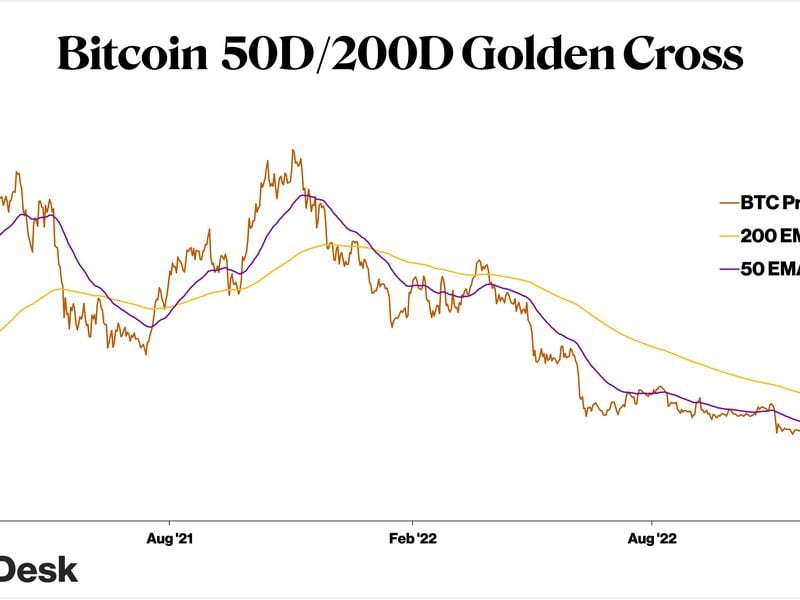
Following prior 50-day/200-day golden crosses, BTC went on to gain 4.4% in the ensuing seven days and surged 9.6% in 30 days. You can’t look at those returns in isolation, though. What does BTC do on average across all seven- and 30-day periods? Worse than just after golden crosses, adding 1.6% and 7.5%, respectively, it turns out. There is, in fact, an edge historically when those moving averages cross.
The best 30-day return happened when BTC soared 67% in April and May 2019 following a golden cross. The worst period was the 18.2% loss in May and June 2018.
For ETH (the second-biggest cryptocurrency by market cap, trailing only BTC), golden crosses have not been a bullish indicator. Average seven- and 30-day results were losses of 2% and 8%, respectively. A buy-and-hold strategy has made a lot more sense for ETH than simply getting long the asset based on a moving-average crossover. That statement is informed strongly by ETH’s average performance across all seven- and 30-day spans: gains of 1.5% and 7.3%, respectively.
Surprisingly to me, golden crosses have also been quite rare in more traditional asset classes. For instance, I looked at three big U.S. stock market indexes: the S&P 500, Dow Jones Industrial Average and Nasdaq Composite. The S&P 500 has seen three golden crosses since the beginning of 2015, while the other two benchmarks had five. Each posted positive 30-day returns in the aftermath. The Nasdaq led the way at 1.5% while the S&P 500 returned 1.15% and the Dow was up 1.13%. I’d argue that none of those returns are worth getting overly excited about.
Taking a step back, though, it is striking that for four of the five assets reviewed (all but ETH), gains were positive 30 days following a golden cross. Over time I think it makes sense to apply the same process to a wider range of cryptocurrencies to identify patterns, if they do indeed exist.
In candor, I wrestle with the significance of the golden cross for crypto given debates around causation versus correlation. I’m also of the opinion that the traditional 50-day/200-day moving average timeframe may have more applicability in traditional finance than in this new frontier of digital assets. Time and testing will be the judge of that. And, finally, I have to question whether the rarity of crosses means that it deserves additional attention – or none at all. I think the truth is somewhere in the middle, with the overarching message being that no single indicator should be viewed in a vacuum.
Crypto Diversification Is Back in 2023
Following the bloodbath of 2022, those not paralyzed by shell shock appear to be extremely bullish and loving it. The CoinDesk Market Index (CMI), our broad benchmark of the cryptocurrency market, is up 40% in 2023. Bitcoin (BTC) up 37%. Even Solana’s SOL has surged almost 150%, rebounding after falling hard in the aftermath of supporter Sam Bankman-Fried’s downfall.

It’s not just crypto. Tesla (TSLA) shares are up almost 100% from their lows of a month ago. Meme-stock favorite Bed Bath & Beyond (BBBY) soared so much even as the company faces a potential bankruptcy that the company announced it would sell equity to raise needed money. Ryan Cohen, a meme-stock investor, is making moves again with Nordstrom (JWM) and Alibaba (BABA). Cathie Wood boldly states her ARK Innovation ETF (ARKK) is “the new Nasdaq” after rising 40% in January (while underperforming the Nasdaq-100 by almost 80% on a five-year time horizon). What’s going on here?!?
It feels like markets have regressed to an optimistic, 2021-style mindset due to the U.S. Federal Reserve slowing the pace of interest-rate hikes. The front end of the U.S. yield curve shows this. Just look at the yield difference between six- and 12-month Treasury bills; they are pricing in a Fed rate cut in the third or fourth quarters of this year. (The longer-term yields are now higher than shorter-term ones, leading me to make that observation.)

(source: CDI Research, Investing.com)
After last week’s Federal Open Market Committee (FOMC) meeting, which resulted in only a 25 basis point rate increase, traders interpreted Chairman Jerome Powell’s relatively balanced comments as an indication the central bank will soon slow its efforts to tame inflation via hikes – fueling the continued buying spree in markets for anything and everything not bolted down.
So-called “bond king” and Doubleline Capital Chief Investment Officer Jeffrey Gundlach has noted that the Fed has historically set its policy rate based on following the two-year Treasury yield on a lagged basis. With the two-year yield crossing the effective federal funds rate, we see that this leading indicator of future rate expectations is calling for cuts. But the real question is the immediacy and timing of any reductions. So, how soon is now?
Digging into the last two rate-hiking cycles (see below), we can see that the two-year yield was under the fed funds rate for a year during the 2016-2019 cycle and two years during the 2004-2008 cycle. These two periods suggest higher rates for longer than the six months priced into the market.

Inflation expectations (as derived from Treasurys including inflation-linked TIPS) are coming down from their 2021-2022 peak, but are still above the average levels seen following the 2008 financial crisis. This is great news, but it should be taken with a grain of salt as the Fed itself holds a sizable portion of the TIPS market (estimated at 25% in 2022, according to Jim Bianco), which may distort the signal sent by this indicator. Add in the unexpectedly strong jobs report last Friday, mixed in with lingering concerns over the effectiveness of the Phillips Curve, and you’ve got conditions of substantial uncertainty that could force the Fed to wait and see before cutting rates to minimize the chance of a policy error.
Put another way, we may be nearing the Fed’s peak squeeze pressure on the economy, but are still uncertain how long the squeeze will last. So far the economy appears to be resilient and in good spirits, but the inflationary temperament remains. The Fed doesn’t appear to have as strong of a read on the economic pulse as it once did, which is muddled by market distortions and supply chain reverberations caused by the coronavirus pandemic. We can only hope the Fed decisively catches the economy if the patient suddenly collapses.
- Todd Groth, CFA, head of index research at CoinDesk Indices
Takeaways
From CoinDesk’s Nick Baker, here’s some recent news worth reading:
- NO DOLLARS: News that Binance was shutting off deposits and withdrawals in U.S. dollars caused quite the stir. The crypto exchange didn’t specify why it was doing this, but crypto businesses have long struggled to maintain ties to conventional banks. And regulators are signaling reluctance about linking crypto to the traditional financial system. For instance, the Federal Reserve recently denied crypto bank Custodia’s application for Fed system membership.
- NICE STAKE: In September the Ethereum Merge, as is well known by now, brought in a new era for that major crypto ecosystem, shifting it to being run by a proof-of-stake (PoS) system from the energy-intensive proof-of-work (PoW) technique that Bitcoin pioneered. There was a shortcoming, however: You can stake your ETH, but you can’t currently get it back by unstaking it. But that deficiency is looking more likely to go away soon, following a successful test this week of withdrawing staked ETH.
- POUND SAND: As headlines proclaim the potential arrival of a “Britcoin,” the Bank of England wants there to be no confusion: if it issues a digital pound, it will be nothing like bitcoin and other cryptocurrencies. “Indeed, nothing could be further from the truth," Bank of England Deputy Governor Jon Cunliffe said.
- BOWLED OVER: If you watched the Super Bowl a year ago, crypto’s presence was unavoidable. There was that Larry David commercial for FTX, plus more from other crypto companies. In 2023, there will be no crypto ads, the Associated Press reported. It’s yet one more sign of the blow to the industry’s reputation caused by FTX’s collapse.
Related news

Three Arrows Capital Founders Launch Exchange Where You Can Trade 3AC Bankruptcy Claims

Bitcoin Miners Surface for Air as Sliding Natural Gas Price Provides Cost Relief

FanDuel Co-Founders Raise $4M for Digital Music Collectible Startup Vault

Bank of America: Innovation to Expand Decentralized Finance Functionality Over Time

Bitcoin Exchange LocalBitcoins to Close, Citing Market Conditions


