Bitcoin in the Charts - Sloping Trendline

We look at how the sloping trendline, which has shifted from resistance to support, can tell us about the price of the leading crypto asset in the next weeks.
The downward sloping trendline, formed by connecting the previous all-time high (ATH) and the succeeding lowering peaks, is one of the most informative technical indicators that could be used to interpret Bitcoin's current course.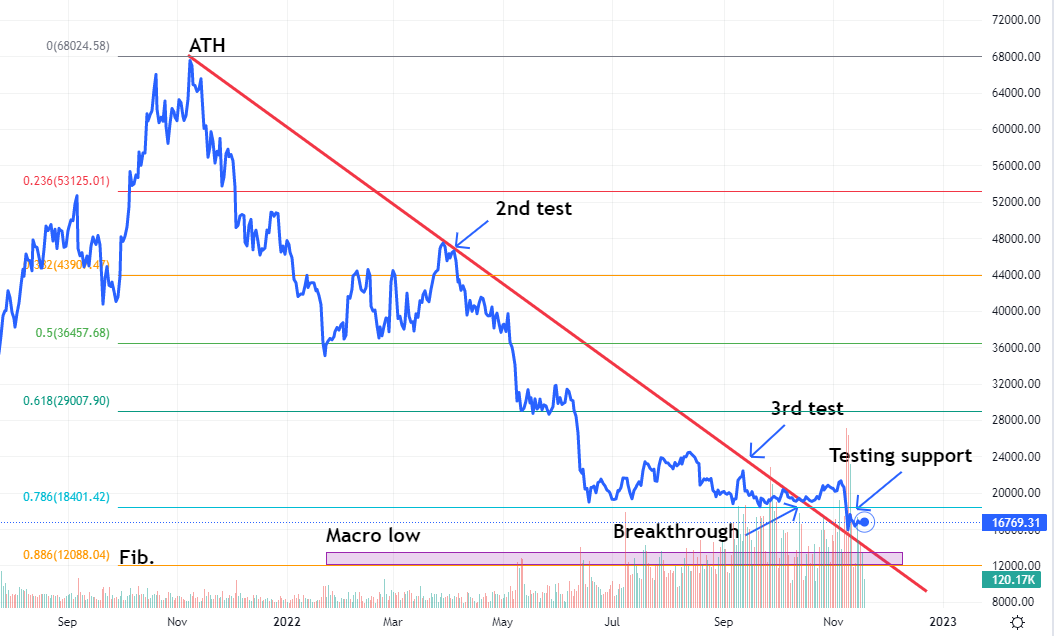
Figure 1: Daily Bitcoin Chart (TradingView)
Trendlines are a type of support or resistance that prevents an asset's price from falling or rising. The current trendline meets the criteria for a valid trendline as it was tested three times. Following the peak on November 10, 2021, the first attempts were made at the end of March and the beginning of April. On September 13, 2022, the price was rejected once more. Bitcoin eventually broke through at the beginning of October 2022. It hasn't quite made it out of the woods yet.
Once such a resistance line is broken from below, price is likely to drop and retest the former resistance - now turned support - line from above, before beginning the next leg up.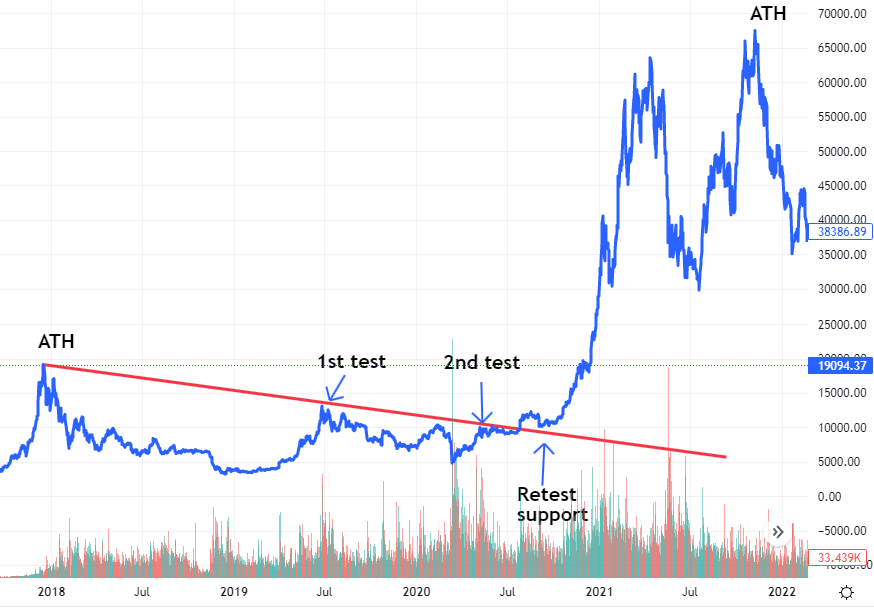
Figure 2: Weekly Bitcoin Chart (TradingView)
The turbulent attempts at recovery over the prior market cycle are a classic illustration of this principle. The all-time high in December 2017, the decreasing peak at the end of June 2019, and the test at the end of May 2020, form the downward trendline. Price broke through the resistance towards the end of July. The trendline was retested as support at the end of August before a market reversal led a 600% increase in the price of bitcoin.
It is not uncommon for price to test the support level multiple times or even trickle down the slope. However, the more a support line is tested, the weaker it becomes and the more likely it is that it will fail ...
Traders and investors can currently benefit from cross-referencing with other signals and indicators ("confluence" in technical analysis terms) to identify potential reversal zones off the sloping support, which may represent strong buying opportunities.
One such level is the macro bottom region found in the $12k to $13.5k support range (Figure 1).
Another is the 88.6% Fibonacci retracement level, which also aligns to the macro, near $12k (Figure 1).
Fibonacci levels are used to identify critical reversal points, as well as areas of support and resistance. They are based on the Fibonacci sequence, and the 88.6% level is calculated by squaring the golden ratio (0.618).
Although the indicators do not suggest that the price will test $12k, they do point to major support at the level our descending trendline will reach by the end of the year. According to the same Fibonacci indicator, BTC is seeing resistance in breaking through the critical 0.786 Fibonacci barrier at $18.4k...
Do you want to know more about Fibonacci? Keep an eye out for an upcoming blog article on this powerful indicator so that you can make it part of your strategy.
You can BUY or SELL Bitcoin, simply and securely, with XBO.
Disclaimer: Our content does not constitute financial advice. It is only intended for informational and educational purposes.


