Dogecoin Above 200-Day Moving Average By Most Since June 2021

The Twitter-inspired rally in the price of Dogecoin (DOGE) over the past week has pushed that crypto well above its technically notable 200-day moving average.
Trading at below $0.06 one week ago, DOGE rallied to above $0.15 at its high on Tuesday thanks to Elon Musk closing his Twitter purchase and hope of some sort of integration with the popular social media platform.
As of Tuesday, the ratio between DOGE's going market price and the 200-day simple-moving average (SMA), also known as the Mayer Multiple, stood at 1.83, the highest since June 2021, according to data provided by charting platform TradingView.
Not surprisingly Dogecoin's Mayer Multiple is the highest among the top 20 cryptocurrencies by market capitalization.
"Dogecoin rallied over 100% last week on speculation of integration with Twitter. The surge is meaningful on its chart, noting the breakout above the 200-day MA and former peaks," Katie Stockton, founder and managing partner of Fairlead Strategies, wrote in a note to clients.
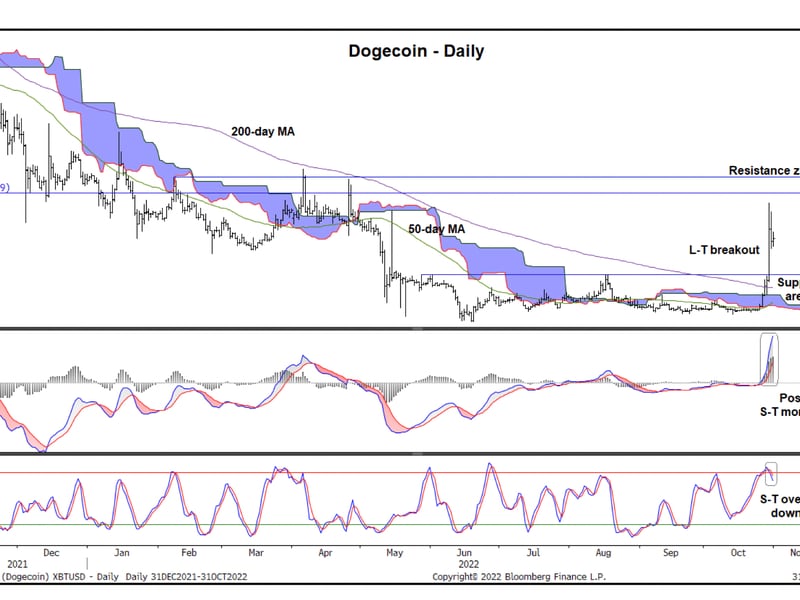
The chart shows DOGE has surged past its 200-day SMA, Ichimokou cloud (the blue shaded area) and the Aug. 16 high of $0.0917, turning the resistance into support. Crossovers above or below the cloud are widely taken to represent early signs of a bullish or bearish trend change.
According to Stockton, DOGE's breakout may have long-term implications if the bulls manage to build a new base above the former resistance-turned-support of $0.0917 marked by the horizontal line on the above chart.
Yet chasing the rally now may be risky, due to the possibility of a "sell the news" event, according to Stockton. Musk completed his $44 billion acquisition of Twitter late last week. So, traders who bought DOGE ahead of that event might book profit, fueling a price pullback.
This may be happening already as DOGE is down 8.5% on Wednesday morning to $0.129, now off nearly 17% from its peak level on Tuesday.
And while the MACD histogram, the indicator below the price chart, shows strong upward momentum, the stochastic oscillator has turned lower from above-80 or overbought levels, suggesting scope for a bull breather or temporary price pullback. Chart analysts use the MACD to gauge trend strength and trend changes and stochastic to identify overbought and oversold levels.
Related news

BlackRock's Bitcoin ETF Snaps 71-Day Inflows Streak, Data Show

Why Base Chain Has Potential to Lock the Next Generation of Crypto Users

Renzo Restaked ETH Suffers a Brief Crash on Uniswap

First Mover Americas: Hedera's HBAR Soars on Exaggerated BackRock Link

Number of Stablecoin Holders Nears 100M Mark, Data Show


