Bitcoin's Price Action is Encouraging, Yet it May Not Signal Bottom: Traders

It's winter out there in the real word and the digital assets market, yet crypto twitter is going bottom fishing.
And why not, as bitcoin (BTC), the leading cryptocurrency by market value, has recently bounced 10% to over $17,000 despite lingering FTX contagion fears and crypto lender Genesis filing for bankruptcy.
The Federal Reserve's chairman Jerome Powell on Wednesday signaled that the central bank could slow the pace of liquidity-sucking interest rate hikes starting from December. Popular technical analysis indicators signal downtrend exhaustion in bitcoin, the leading cryptocurrency by market value.
Some experts, however, called for caution as bitcoin's price action is yet to satisfy all conditions necessary to confirm a bear market bottom and a bullish revival.
"As we have seen three attempts this year that eventually failed, we need to wait for bitcoin prices to trade above their 21-week moving average ($20,851) in order to call for a sustainable rally and a cyclical low," Markus Thielen, head of research and strategy at crypto services provider Matrixport said.
Bottom fishing refers to investing in an asset with a substantial price decline. The high-risk, high-reward approach is based on the assumption that the asset is undervalued and due for a reversal higher.
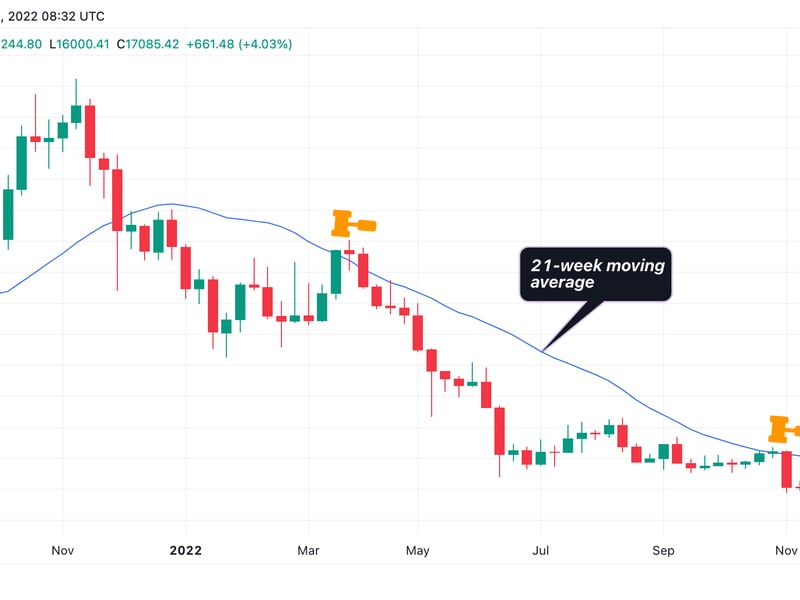
Bitcoin turned lower from the 21-week moving average in early November and fell to a two-year low of $15,460 on Coinbase. The late March attempt to scale the average also paved the way for a deeper sell-off.
Therefore, a convincing move above the average is needed to confirm a bottom.
According to Caleb Franzen, founder of the research firm and newsletter Cubic Analytics, a bull revival would be confirmed once bitcoin prints a positive "Heikin Ashi" candle on the monthly chart.
Heiken Ashi and traditional candlesticks are constructed using an asset's open, high, low and close prices for a specific period. Heiken Ashi, however, is an averaged version of traditional candlesticks. Therefore, it helps cut through the noise and facilitates better gauging of trend reversals than traditional candles.
"After 5+ months of red candles, a green monthly candle has [historically] marked the end of each bear market," Franzen tweeted Monday, calling for patience on the part of the bulls as bitcoin produced its 12th consecutive red monthly Heikin Ashi candle in November.
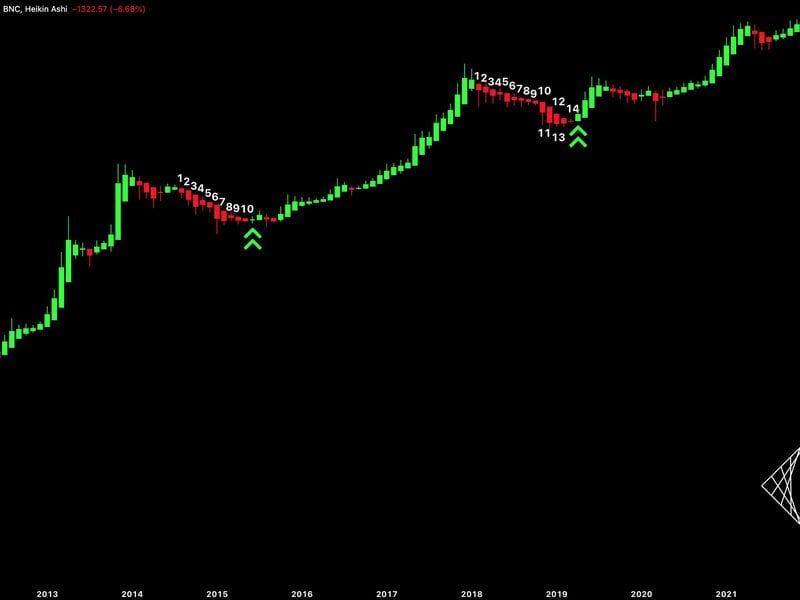
The latest red streak on the monthly Heiken Ashi chart is the second-longest on record. Bitcoin produced 14 straight red candles from February 2018 to March 2019 before confirming a bull revival with a green candle in April 2019.
At press time, bitcoin changed hands at $17,080, representing a 0.5% drop on the day.
The cryptocurrency's weekly chart shows a bullish divergence of the relative strength index, a popular technical analysis tool used to gauge overbought and oversold conditions.
A bullish divergence occurs when the RSI does not confirm a new low/cyclical price low. In other words, while the price goes down, the RSI remains steady or goes up.
Chart analysts and traders consider it an early sign of an impending positive trend change.
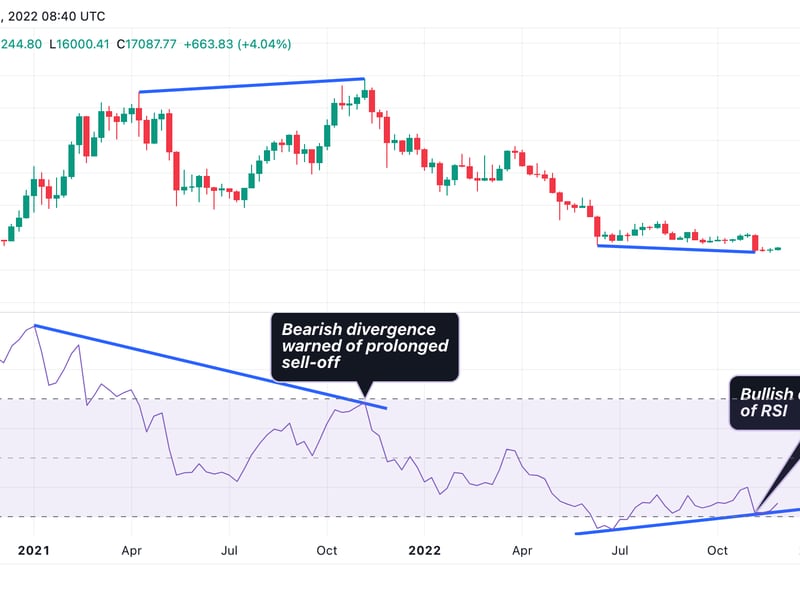
"It's interesting to note that the relative strength index peaked already in January 2021 for this cycle and did not confirm bitcoin's second top in 22. Now, this indicator also signals that the downturn may have fully played out," Thielen said in a note to clients on Wednesday.
Related news

First Mover Americas: Bitcoin Drops Below $64K, Ether Falls

BlackRock's Bitcoin ETF Snaps 71-Day Inflows Streak, Data Show

Why Base Chain Has Potential to Lock the Next Generation of Crypto Users

Renzo Restaked ETH Suffers a Brief Crash on Uniswap

First Mover Americas: Hedera's HBAR Soars on Exaggerated BackRock Link


